Coverage for the week of April 3rd - April 7th: As we move into a short week, our experts analyzed the e-mini S&P 500 Futures, micro Nasdaq 100 Futures, e-mini DOW Jones Futures and e-mini Russell 2000 Futures. They also reviewed how a short week can affect economic reports and what that may mean for your trading strategy. Read more.
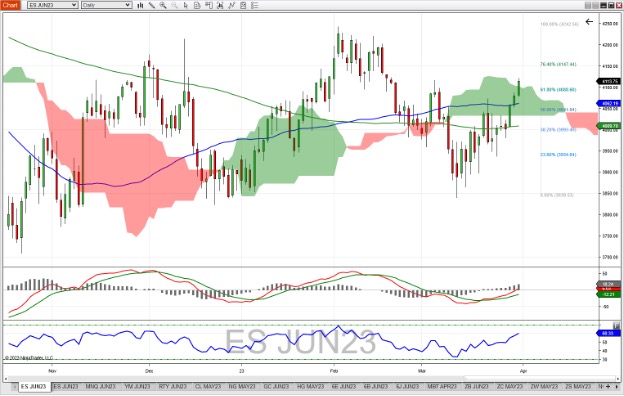
E-Mini S&P 500 Futures Daily Chart
Last week the June E-Mini S&P 500 future showed signs of increased bullishness as it broke above the 50-day and 200-day moving averages. It also began the week below the Ichimoku cloud, but journeyed through to the top side of the cloud by week’s end. The MACD indicator continued its bullish trend, with the MACD line crossing above 0. RSI continues to trend up finishing the week just above 60 with room to grow to an Overbought level of 70. Having eclipsed the 61.8% Fibonacci retracement level of the previous downtrend from 2/2/23 to 3/13/23, the next upside targets could be 4147 (76.4 % Fib retracement) and previous highs at 4242. Should the market falter, look for support at 4100 (top of the Ichimoku cloud) and 4065 (50-day moving average).

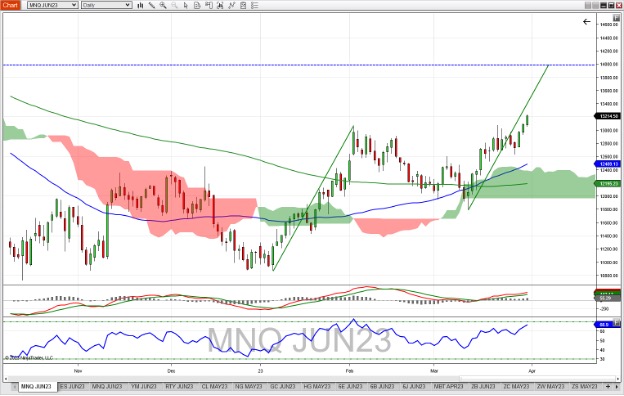
Micro NASDAQ 100 Futures Daily Chart
The June Micro NASDAQ 100 continued to lead stock index futures higher, taking out previous highs in early February. NASDAQ is trading well above its 50- and 200-day moving averages, as well as the Ichimoku cloud. The MACD continues to be bullish (for about two weeks now) and the RSI is nearing the overbought level of 70. Be aware that a market can stay overbought in extended uptrends. Using the previous uptrend from the beginning of the year as a guide, extending that same trend range to the recent lows in mid-March indicates an upside target of 14000, which seems fairly far away until you realize that it is only about 3 Average True Range (ATR) lengths from last week’s close.
Support could be found at 12500 (50-day moving average) and 12400 (the top of the Ichimoku cloud).

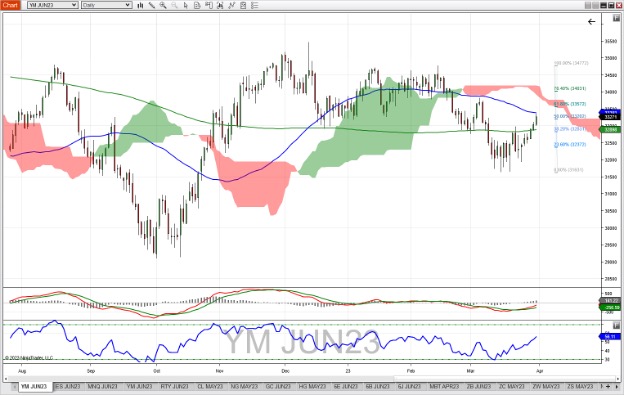
E-Mini Dow Jones Futures Daily Chart
The June E-Mini Dow Jones future (YM) show some strength last week as it closed above the 200-day moving average, though it still failed to reach the other side of the 50-day moving average. It also is well below the Ichimoku cloud, so there still is work to be done to feel more confident about a bullish trend on the $5 Dow. The MACD did turn bullish last week, and the RSI at 56 has room to go to get to 70. This could be the early stages of a bullish trend as the Dow seems to be playing catch up with the S&P 500 and NASDAQ. Upside targets/areas of resistance could be 33575 (61.8 % Fibonacci retracement of previous downtrend) and 34030 (76.4 % Fib retracement of the same trend). Support could be found at 32830 which corresponds with the 200-day moving average and the 38.2 % retracement area.

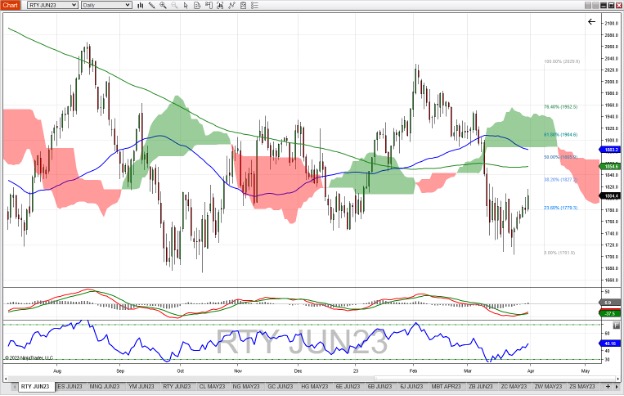
E-Mini Russell 2000 Future Daily Chart
The June E-Mini Russell future (RTY) continued the rally of recent lows in the 1720-1740 area. Despite the strong finish at the end of last week, price is still well below the 50- and 200-day moving averages and the Ichimoku cloud. The MACD gave a bullish indication with the MACD line crossing above its moving average (as shown by the histogram turning positive). RSI is in an uptrend, but still somewhat weak, as it closed just below the half way mark. If the bullish trend continues, look for 1827 (38.2% retracement level of the previous downtrend) as a possible resistance area, with the next target at ~1850 (200-day moving average). Support could be found at 1780, the 23.6% retracement level of the same trend.

Economic Reports for the week of April 3rd – April 7th
This week is a shortened week due to the Good Friday holiday, which affects the release date of a few reports. The Manufacturing sector of the economy is the focus for the beginning of the week, as ISM and S&P Global publish their Manufacturing reports. The U.S. Census Bureau puts out the Construction Spending report on Monday and Factory Orders on Tuesday – put together, these can indirectly inform as to whether the labor market will cool down. A more direct look into the labor situation will come almost every day, starting Tuesday with the JOLTS report, Wednesday with ADP Employment, Thursday with Jobless Claims and Friday with the Employment Situation. Look for market reaction when JOLTS and Jobless claims are published. Normally the same would be said for the Employment Situation – however this week most U.S. markets will be closed at the time this report drops. Federal Reserve Bank Presidents Loretta Mester (Cleveland) and James Bullard (St. Louis) are scheduled to speak this week, with Bullard speaking 30 minutes after the regular trading hours open on Thursday. For traders interested in agriculture products, Monday brings the weekly Crop Progress and Export Inspections reports, as well as the monthly Grain Crushings and Fats and Oils reports. The Baker Hughes Rig Count report is pushed up a day to Thursday because of the holiday on Friday.
***Market Moving Indicators
*Merit Extra Attention
|
Date |
Economic Reports |
|---|---|
|
Monday, April 3rd |
9:45 AM ET: PMI Manufacturing Final |
|
Tuesday, April 4th |
8:00 AM ET: Motor Vehicle Sales |
|
Wednesday, April 5th |
7:00 AM ET: MBA Mortgage Applications |
|
Thursday, April 6th |
7:30 AM ET: Challenger Job-Cut Report |
|
Friday, April 7th |
8:30 AM ET: Employment Situation |
Be sure to check back weekly and follow us on our social media accounts to receive alerts of our Futures Outlooks week to week.
Get Started with NinjaTrader
NinjaTrader supports more than 800,000 traders worldwide with a powerful and user-friendly trading platform, discount futures brokerage and world-class support. NinjaTrader is always free to use for advanced charting and strategy backtesting through an immersive trading simulator.
Download NinjaTrader’s award-winning trading platform and get started with a free trading demo with real-time market data today!

