Coverage for the week of March 6th - March 10th: The technical analysis this week includes a review of E-Mini S&P 500 Futures, Micro NASDAQ 100 Futures, E-Mini DOW Jones Futures and E-Mini Russell 2000 Futures in addition to important economic reports being released. There are no company reports of note coming up this week. Read more to prepare for your week ahead!
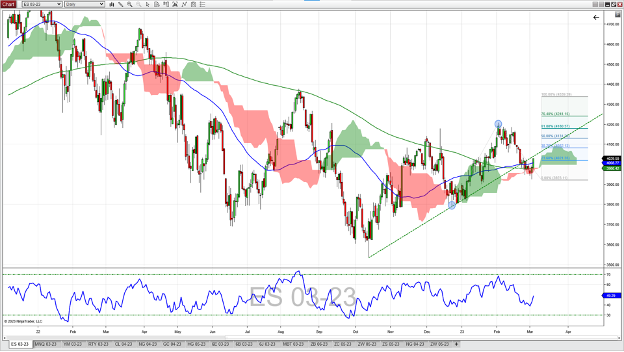
E-Mini S&P 500 Futures Daily Chart
On Friday, the March E-Mini S&P 500 future broke back above the 50-day and 200-day moving averages as well as a support line connecting the lows from October 13 and December 22. The Ichimoku cloud held as support last week and shows an increasing upper portion in the month ahead. Relative Strength Index (RSI) could not get down to the overbought level of 30, bottoming out at 38.88. The current trend up to 50+ is in line with price activity. Price resistance may be found at the 38% Fibonacci Extension level (4082) and the 50% Fib Extension (4131). This is an extension of the uptrend beginning at the low on December 22 to the high on February 2. If the trend reverses, support levels could be found at 3980 (the 200-day moving average which corresponds to the top of the cloud) and the recent low at 3923.

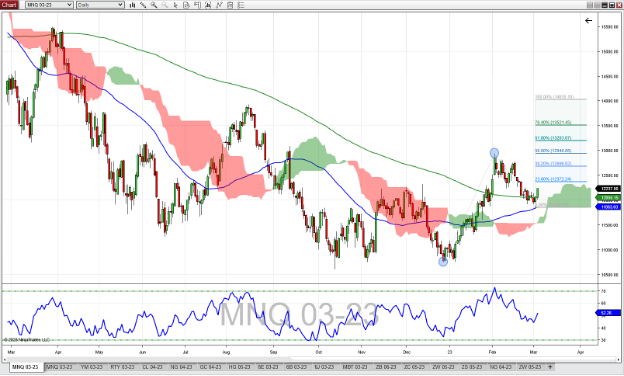
Micro NASDAQ 100 Future Daily Chart
The March Micro NASDAQ 100 future traded down to the 50-day moving average on Thursday, with buyers rejecting that level, ultimately closing above the 200-day moving average. The rally continued on Friday, gaining back almost 80% from the previous week’s highs. The Relative Strength Index (RSI) is trending up with this latest rally at 53.5 – and still has some room to get to an overbought level of 70. Upside targets of 12370 and 12690 are possible, based on the 23% and 38% Fibonacci Extension of the previous uptrend from December 28, 2022 to February 3rd, 2023. Support is possible at the 200-day moving average (12055) and the 50-day moving average (11865). Further support at the top of the Ichimoku cloud can occur, at prices that vary depending on when the market trades to the cloud.

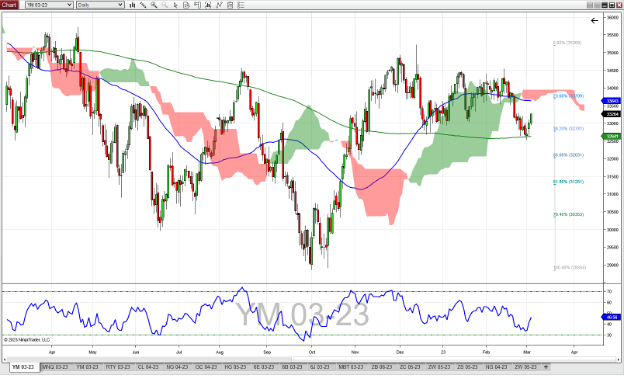
E-Mini Dow Jones Future Daily Chart
The March E-Mini Dow Jones future (YM) rallied off the 200-day moving average, trading well above the psychological level of 33,000. An unusual gap up to open Thursday followed by continuation buying on Friday made for a positive week. The RSI traded as low as 34 but could not get into overbought territory before the market reversed and brought the RSI up to almost hallway at 47. Should the bullish trend hold, look for resistance in the 33650 – 33710 area (50-day moving average, 23% Fibonacci retracement, and the bottom of the Ichimoku cloud). Support areas include 32780 (38% Fib retracement) and 32640 (200-day moving average).

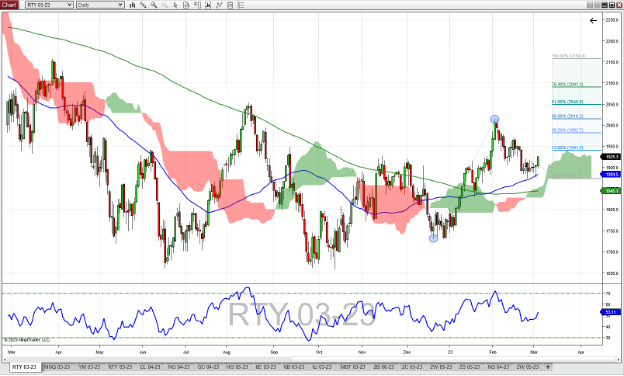
E-Mini Russell 2000 Future Daily Chart
The March E-Mini Russell future (RTY) rallied at the end of the week after testing the 50-day moving average as support. This could be what’s needed to confirm a higher swing low (compared to the last swing low in December). The RSI at 53 is mirroring recent price action, trending up with price, but still short of the over bought level of 70. The Ichimoku cloud study isn’t relevant now but could become important this week should the cloud hold as support. The Fibonacci Extension from recent lows, as measured from the low in December to the high in February, indicates possible resistance at 1941 and 1982. Support to the downside is found at ~1885 (50-day moving average) and ~1845 (200-day moving average which coincides with the top of the cloud).

Economic Reports for the week of March 6th to March 10th
Federal Reserve Chair Jerome Powell meets with Congress this week, testifying at the Senate Tuesday morning and at the House of Representatives on Wednesday. Look for Powell to make a case for higher interest rates as they try to get inflation down to a target rate of 2-3%. Wednesday is loaded with economic reports covering housing, labor, and manufacturing. The EIA Petroleum report could impact crude oil and gasoline futures markets Wednesday morning, and the monthly WASDE numbers (agriculture supply and demand) arrive at noon with video commentary by the Secretary of Agriculture’s staff five minutes later. The Fed Beige Book details economic activity in the 12 Fed districts and is published 8 times a year. Jobless claims on Thursday and the Unemployment Situation on Friday could provide more insight into what the Fed may do with regards to interest rates.
*** Market Moving Indicators* Merit Extra Attention
|
Date |
Economic Reports |
|---|---|
| Monday, March 6th | 10:00 AM ET: Factory Orders 11:00 AM ET: Export Inspections 12:30 PM ET: Investor Movement Index |
| Tuesday, March 7th | 10:00 AM ET: Wholesale Inventories (Preliminary) 10:00 AM ET: Fed Chairman Jerome Powell Testifies at the Senate Banking Committee*** 3:00 PM ET: Consumer Credit @federalreserve |
| Wednesday, March 8th | 7:00 AM ET: MBA Mortgage Applications 8:15 AM ET: ADP Employment Report 8:30 AM ET: International Trade in Goods and Services 10:00 AM ET: JOLTS* 10:00 AM ET: Fed Chairman Jerome Powell Testifies at the House Financial Services Committee*** 10:30 AM ET: EIA Petroleum Status Report* 12:00 PM ET: USDA Supply/Demand – Soybean, Cotton, Wheat* 2:00 PM ET: Beige Book |
| Thursday, March 9th | 7:30 AM ET: Challenger Job-Cut Report 8:30 AM ET: Export Sales 8:30 AM ET: Jobless Claims* 10:30 AM ET: EIA Natural Gas Report 4:30 PM ET: Fed Balance Sheet |
| Friday, March 10th | 8:30 AM ET: Employment Situation*** 1:00 PM ET: Baker Hughes Rig Count 2:00 PM ET: Treasury Statement |
Be sure to check back weekly and follow us on our social media accounts to receive alerts of our Futures Outlooks week to week.
Get Started with NinjaTrader
NinjaTrader supports more than 800,000 traders worldwide with a powerful and user-friendly trading platform, discount futures brokerage and world-class support. NinjaTrader is always free to use for advanced charting and strategy backtesting through an immersive trading simulator.
Download NinjaTrader’s award-winning trading platform and get started with a free trading demo with real-time market data today!

