In this week’s coverage, we analyze uptrend in the Russell 2000 and the pullbacks in the Euro FX, natural gas and copper futures charts. We also examine the economic reports and earnings announcements expected next week.
Commentary and charts reflect data at the time of writing. Market conditions are subject to change and may not reflect all market activity.
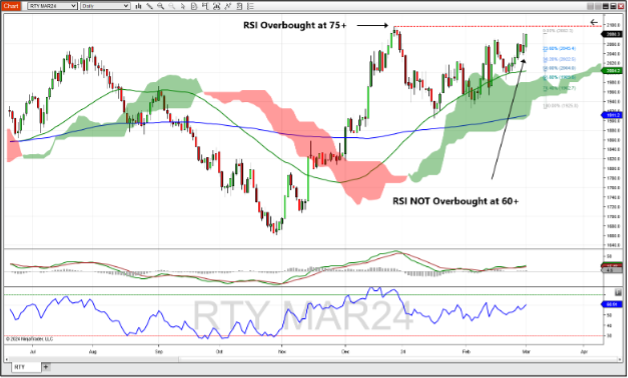
March E-Mini Russell 2000 Index Futures Daily Chart
March E-mini Russell 2000 Index futures continued the rally after the prior week's bounce off the 50-day moving average, taking out the recent high of 2,071. The Russell is trading well above the 200-day moving average and the top of the Ichimoku cloud, as well. Despite this bullish action, the MACD histogram that is just above 0, only slightly bullish. While the Russell is trying to get back to its previous high of 2,097, cause for concern is the Relative Strength Index (RSI) in the same set of circumstances. When the market traded at 2,097 at the end of last year, RSI was overbought over 75. As we near that same price level, RSI isn't close to being overbought, trading just above 60. This might be divergence, although we'd like to see a downturn in both price and RSI to confirm. If this market continues to trend, look for a retest of the high at 2,082.3. A reversal to the downside might see support at the 23.6% Fib level (2,045) and further on down at the 50% fib level which corresponds to the 50-day moving average (2,004).

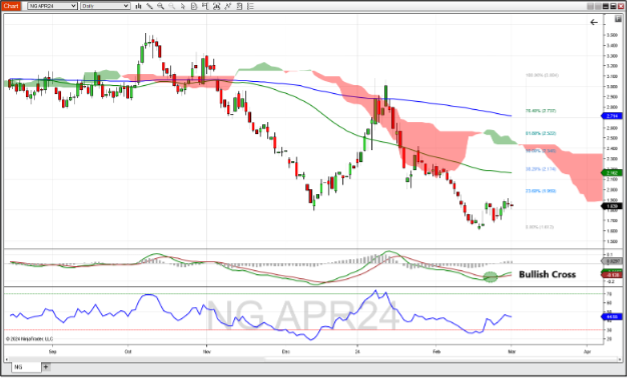
April Natural Gas Futures Daily Chart
April natural gas futures finished the week in positive territory due to two strong bullish advances on Tuesday and Wednesday. Nat gas is still well below the 50-day moving average, the 200-day moving average, and the Ichimoku cloud. The MACD histogram remains positive after a bullish cross the prior week. The RSI can't quite get above the neutral mark of 50 with Thursday and Friday’s pullbacks. A resumption of the uptrend could see some resistance at the 23.6% Fibonacci retracement level of the move that occurred from January 12 to February 19 (1.959). Further resistance might be found at 38.2% Fib level which corresponds with the 50-day moving average (~2.170). If the trend turns lower look for a retest of the recent low at 1.612.

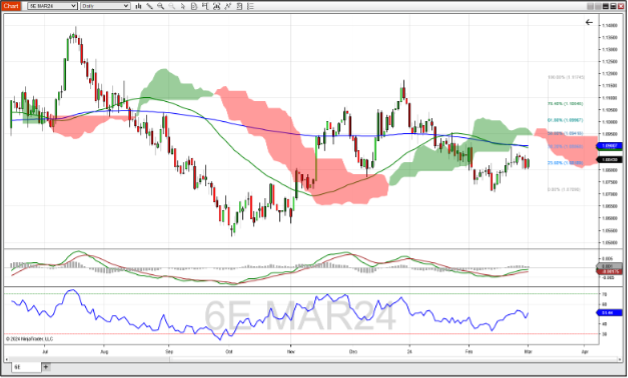
March Euro FX Futures Weekly Chart
March Euro FX pound futures edged just a bit higher last week, though a pullback looked to be in effect if it weren't for Friday’s rally. Euro FX finished just above the 23.6% retracement of the downward move that started at the beginning of the year and culminated with the recent bottom in early February. 6E looked like it might test the 50-day and 200-day moving averages but backed off before the test. Price is also well below the bottom of the Ichimoku cloud. The MACD histogram remains positive with the MACD line itself approaching 0–this could mean a possible start to a bull trend if we see that cross above 0. RSI is trading in line with price. If Euro FX continues to pull back, expect support at the 23.6% fib level and further at the recent low of 1.0709. Expect resistance at the 38.2% Fib level, which corresponds with the moving averages (~1.08870). Further resistance might be found at the bottom of the Ichimoku cloud level which corresponds to the 50% Fib level of 1.0940.

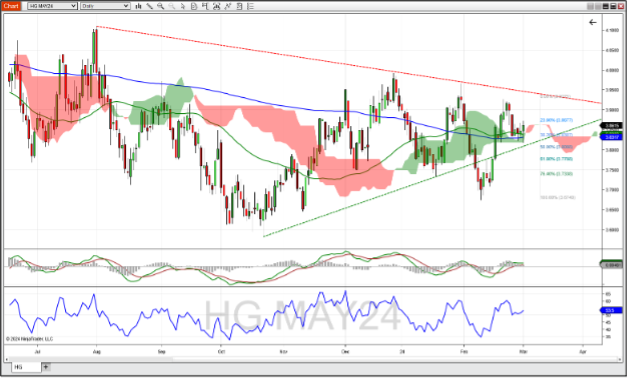
April Copper Futures Weekly Chart
April copper futures saw a slight rebound from last Monday’s big drop, with the 50-day moving average, the 200-day moving average and the top of the Ichimoku cloud all acting as support. Copper also came close to touching the supportive trend line found by connecting lows in October and January. The MACD and its histogram are both positive, but seem to be trending sideways, indicating a small bullish bias. RSI is trading along with price, and at 53 is a somewhat neutral to slightly bullish read. Should the rally continue, resistance might be found at the 23.6% Fibonacci retracement level (3.8677) and at the top of the longer-term resistance line (~3.95). A failure of the moving averages to hold as support could see support at the 50% Fib level (~3.80).

Companies Reporting Earnings March 4 – March 8
A light week for earnings will see about 300 companies report, with most of the bigger companies residing in the retail space. Clothing and apparel retailers are represented by Nordstrom, Abercrombie & Fitch, Foot Locker, Victoria’s Secret, Burlington Store, American Eagle and the Gap. These reports can provide some information as to how consumers will be spending their money on clothing and accessories.
More general retail companies like Target, Ross Stores, Costco, BJ’s, Kroger and JD.com have a broader reach and analysts will be attentive to their guidance as an overall gauge for the market. With Brazil as the world’s fourth largest oil-producing country, PetroBrasil’s earnings report on Thursday may instruct on what the demand is for crude oil for 2024, both in South America and the world at large-so CL traders take note.
Canadian companies’ earnings season starts this week with four banks reporting: Bank of Nova Scotia and Bank of Montreal on Tuesday morning, and TD Bank and Royal Bank of Canada on Wednesday morning.
| Date | Companies Earnings |
|---|---|
| Monday, March 4 | N/A |
| Tuesday, March 5 | Target Corp. (TGT): $2.41 EPS Estimate, $31.85B Revenue Estimate (BMO) Ross Stores Inc. (ROST): $1.63 EPS Estimate, $5.75B Revenue Estimate (AMC) Nordstrom, Inc. (JWN): $0.90 EPS Estimate, $4.38B Revenue Estimate (AMC) |
| Wednesday, March 6 | JD.com, Inc. (JD): $0.64 EPS Estimate, $41.70B Revenue Estimate (BMO) Abercrombie & Fitch Co. (ANF): $2.81 EPS Estimate, $1.42B Revenue Estimate (BMO) Foot Locker, Inc. (FL): $0.34 EPS Estimate, $2.27B Revenue Estimate (BMO) Victoria’s Secret & Co. (VSCO): $2.46 EPS Estimate, $2.09B Revenue Estimate (AMC) |
| Thursday, March 7 | Kroger Co. (KR): $1.13 EPS Estimate, $37.06B Revenue Estimate (BMO) Burlington Stores Inc (BURL): $3.27 EPS Estimate, $3.02B Revenue Estimate (BMO) American Eagle Outfitters, Inc. (AEO): $0.50 EPS Estimate, $1.66B Revenue Estimate (BMO) BJ’s Wholesale Club, Inc. (BJ): $1.06 EPS Estimate, $5.38B Revenue Estimate (BMO) Costco Wholesale Corp. (COST): $3.60 EPS Estimate, $59.20B Revenue Estimate (AMC) PetroBrasil (PBR): $1.11 EPS Estimate, $27.63B Revenue Estimate (AMC) Gap, Inc. (GPS): $0.20 EPS Estimate, $4.21B Revenue Estimate (AMC) |
| Friday, March 8 | N/A |
* indicates that this company is in the Dow Jones Index
Economic Reports for the week of March 4 – March 8
Next week is the last week before the FOMC members enter the quiet period before the next FOMC meeting, with six speakers scheduled for comments. Fed Chair Jerome Powell is scheduled to testify before the House of Representatives on Wednesday and before the Senate on Thursday to give the bi-annual report to Congress.
This, plus the Beige Book on Wednesday afternoon, could give some early insight as to what the FOMC might do with regards to interest rates. The labor market comes into focus beginning on Wednesday, with the ADP Employment report and Job Openings and Labor Turnover Survey (JOLTS) arriving before the open.
Thursday we'll see the Challenger Job Cut report an hour before the weekly Jobless Claims report. Friday morning before market open the employment situation arrives, with the unemployment rate expected to hold steady at 3.7%. The monthly USDA supply and demand report for corn, wheat, soybean and cotton is released at noon Friday, so if you are trading in those markets be aware that some market movement may occur.
| Date | Economic Reports |
|---|---|
| Monday, March 4 | 7:00 AM ET: Motor Vehicle Sales 11:00 AM ET: Export Inspections 11:00 AM ET: Philadelphia Fed President Patrick Harker Speaks |
| Tuesday, March 5 | 9:45 AM ET: PMI Composite Final 10:00 AM ET: Factory Orders 10:00 AM ET: ISM Services Index 1:00 PM ET: Federal Reserve Governor Michael Barr Speaks 4:30 PM ET: Federal Reserve Governor Michael Barr Speaks 4:30 PM ET: API Weekly Oil Stocks |
| Wednesday, March 6 | 7:00 AM ET: MBA Mortgage Applications 8:15 AM ET: ADP Employment Report * 10:00 AM ET: Federal Reserve Chair Jerome Powell Testifies: House * 10:00 AM ET: JOLTS * 10:00 AM ET: Wholesale Inventories (Final) 10:30 AM ET: EIA Petroleum Status Report * 12:00 PM ET: San Francisco Fed President Mary Daly Speaks 2:00 PM ET: Beige Book |
| Thursday, March 7 | 7:30 AM ET: Challenger Job-Cut Report 8:30 AM ET: Jobless Claims *** 8:30 AM ET: International Trade in Goods and Services 8:30 AM ET: Productivity and Costs * 8:30 AM ET: Export Sales 10:00 AM ET: Federal Reserve Chair Jerome Powell Testifies: Senate * 10:30 AM ET: EIA Natural Gas Report 11:30 AM ET: Cleveland Fed President Loretta Mester Speaks 3:00 PM ET: Consumer Credit 4:30 PM ET: Fed Balance Sheet |
| Friday, March 8 | 7:00 AM ET: New York Fed President John Williams Speaks 8:30 AM ET: Employment Situation * 12:00 PM ET: USDA Supply Demand - Corn, Wheat, Soybean, Cotton *** 12:00 PM ET: Crop Production 1:00 PM ET: Baker Hughes Rig Count |
*** Market Moving Indicators
* Merit Extra Attention
Daily Futures Market Prep and Analysis With the Pros
Interact with our experts and other futures traders during daily livestreams as we analyze the markets in real time and explore our award-winning desktop platform. Log in here.
Trade Futures With Us
Sign up for your free NinjaTrader account today to start your 14-day trial of live simulated futures trading.

