Coverage for the week of August 7th – August 11th: In this week’s coverage, we analyze the NASDAQ 100 Index, 10-year notes, crude oil and gold futures. We also examine the economic reports and earnings releases expected next week.
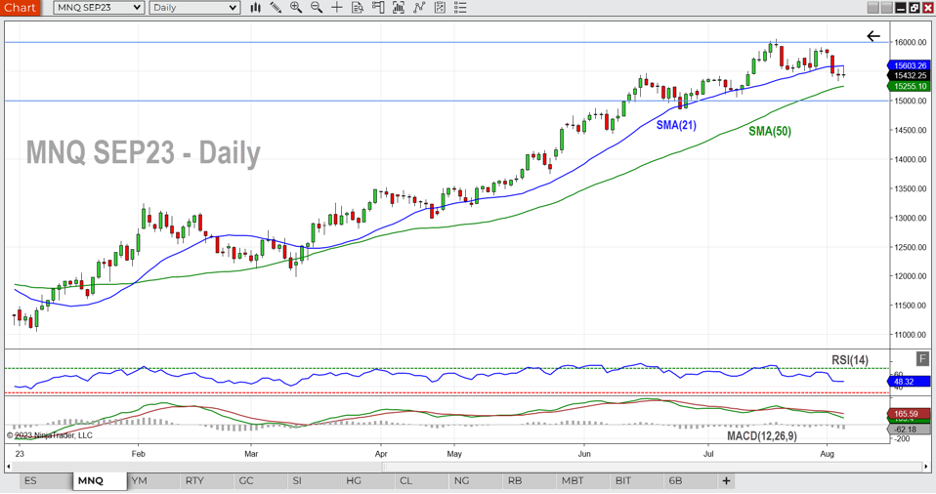
September Micro NASDAQ 100 Future Daily Chart
The September Micro NASDAQ 100 future closed below the previous week in negative territory at around 15365, after falling below the 21-day moving average which had been holding up well as support. The 50-day moving looks to be the next level of support around the 15300 level. Last week at this time the RSI indicator was showing a bit of bearish divergence and we saw that bearish divergence play out this last week. Currently, RSI is in neutral mode at 48.50, not giving us much to go on right now. Looking at the current trend, MACD has been below 0 (bearish) for 12 consecutive days now, but the long term trend is still firmly bullish, as there are always short-lived pullbacks in a bull market move. Should this downward pullback continue into next week, there may be good support at the 15000 psychological price level.

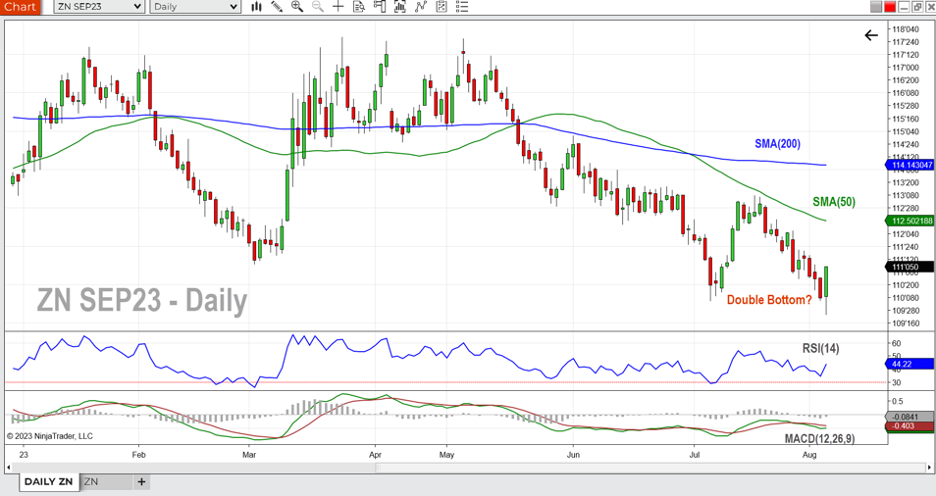
September 10-Year Note Future Daily Chart
September 10-year notes closed lower for the third week in a row at around 111^085, raising the 10-year yield to 4.03 percent. The strong bullish rally on Friday was not enough to finish the week in positive territory, but may be signaling a short-term reversal on a potential double bottom pattern at the 110 level. And although the 10-year notes have been a downtrend since early May, a pullback to the 50-day moving average would not be a surprise here based on the strong pullback in early July. Currently, RSI is in neutral mode at 45.10. The MACD is below zero but turning up on Friday’s rally. 10-year note futures prices are often influenced by economic news and events, for example the recent US debt downgrade by Fitch to AA+ from AAA.

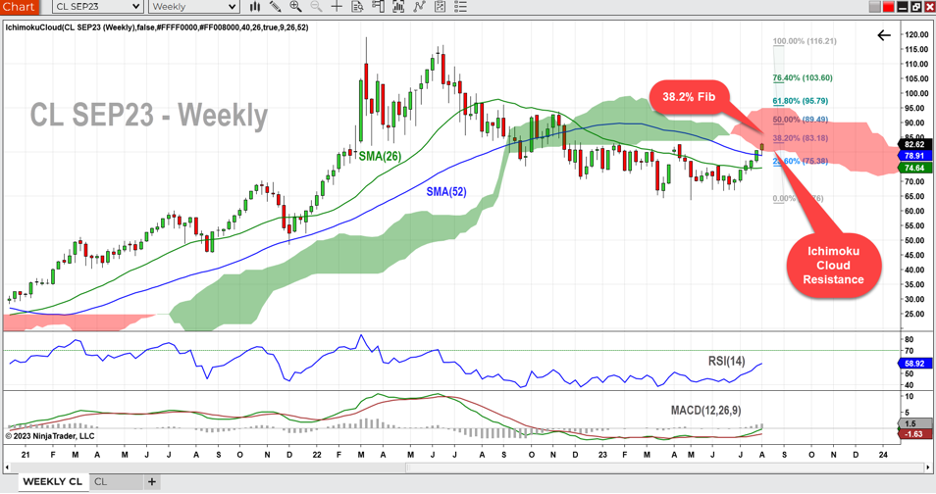
September Crude Oil Future Weekly Chart
September crude oil futures continued to move higher for the sixth straight week in a row, closing at around 82.60, the highest weekly close since November 2022. Last week saw crude oil prices closing above the 52-week moving average after crossing above the 26-week moving average just two weeks before, adding more fuel to the fire this week. MACD is above 0 in bullish territory, and RSI is somewhat over bought at 58.92, but has some room to go. There are, however, some headwinds here for crude: First, the close of the week is getting near the 38.2 Fibonacci retracement level as defined by the downtrend high in June 2022 to the low in May 2023. Second, the Ichimoku cloud looms heavy above the current bar as resistance moving forward. Third, each dollar crude oil moves higher, can potentially bring in commercial hedgers looking to lock in these higher prices.

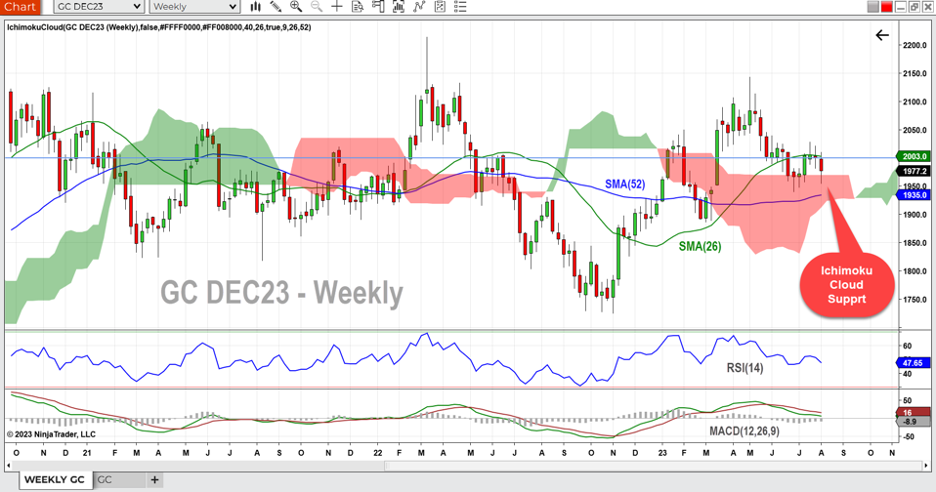
December Gold Future Weekly Chart
December gold futures moved lower for the second week in a row, closing around $1,977 an ounce, with prices ranging during the week from a high $2,010 to a low of $1,954 an ounce. Gold continues to struggle above that key $2,000 level. RSI is in neutral position near 47.54 and MACD has a bearish reading below zero. The downtrend that started in May of 2023 is still in force. We had a bit of a bullish pullback in early July, and that turned into some sideways consolidation, which is the same pattern we are in after the current week. The Ichimoku cloud is acting as a support level at $1,965, and the support level below that could be the 52-week moving average currently at $1,935. Last week’s cross below the 26-week moving average could signal a continuing down trend. Finally, a strong US dollar like we have seen in the past few weeks can also add downward pressure on gold prices.

Companies Reporting Earnings August 7th – August 11th
| Date | Companies Earnings |
|---|---|
| Monday, August 7th | Tyson Foods Inc. (TSN): $0.34 EPS Estimate, $13.63B Revenue Estimate (BMO) |
| Tuesday, August 8th | United Parcel Service, Inc. (UPS): $2.51 EPS Estimate, $23.11B Revenue Estimate (BMO) Eli Lilly & Co. (LLY): $1.98 EPS Estimate, $7.58B Revenue Estimate (BMO) Barrick Gold Corporation (GOLD): $0.17 EPS Estimate, $2.94B Revenue Estimate (BMO) Duke Energy Corp. (DUK): $0.98 EPS Estimate, $6.16B Revenue Estimate (BMO) NRG Energy, Inc. (NRG): $1.07 EPS Estimate, $7.73B Revenue Estimate (BMO) AMC Entertainment Holdings, Inc. (AMC): ($0.05) EPS Estimate, $1.27B Revenue Estimate (AMC) Lyft, Inc. (LYFT): ($0.01) EPS Estimate, $1.02B Revenue Estimate (AMC) |
| Wednesday, August 9th | Sony Group Corporation (SONY): $0.94 EPS Estimate, $18.15B Revenue Estimate (BMO) Honda Motor Co., Ltd. (HUM): $0.99 EPS Estimate, $33.57B Revenue Estimate (BMO) Walt Disney Co (DIS): $0.99 EPS Estimate, $20.30B Revenue Estimate (AMC) * |
| Thursday, August 10th | Alibaba Group Holding Ltd. (BABA): $1.65 EPS Estimate, $31.31B Revenue Estimate (BMO) US Foods Holding Corp. (USFD): $0.73 EPS Estimate, $9.34B Revenue Estimate (BMO) |
| Friday, August 11th | Air Canada (ACDVF): $0.38 EPS Estimate, $3.92B Revenue Estimate (BMO) |
* Indicates that this company is in the Dow Jones Index
Commentary: Small cap stocks take center stage, with just a handful of companies with earnings of $1 billion or larger reporting this week. Notable exceptions are Walt Disney reporting after markets on Wednesday, which might affect Dow Jones Index futures; Honda Motors reports Wednesday morning and could shed light on forward outlook for the automobile industry; and Alibaba reports before market open on Thursday, which could inform us about consumer behavior in the retail market.
Earnings for Duke Energy and NRG Energy on Tuesday morning could be affected by volatility in the crude oil market. Air Canada could also be affected by energy markets and could give insight into the travel and entertainment segment of the economy. With so many small caps reporting, look out for the possibility that Russell 2000 Index futures (RTY) price action may behave differently than NASDAQ, Dow Jones and S&P 500 Index futures.
Economic Reports for the week of August 7th – August 11th
| Date | Economic Reports |
|---|---|
| Monday, August 7th | 11:00 AM ET: Export Inspections 3:00 PM ET: Consumer Credit 4:00 PM ET: Crop Progress |
| Tuesday, August 8th | 6:00 AM ET: NFIB Small Business Optimism Index 8:30 AM ET: International Trade in Goods and Services * 10:00 AM ET: Wholesale Inventories (Preliminary) * 4:30 PM ET: API Weekly Oil Stocks |
| Wednesday, August 9th | 7:00 AM ET: MBA Mortgage Applications 10:30 AM ET: EIA Petroleum Status Report * |
| Thursday, August 10th | 8:30 AM ET: CPI *** 8:30 AM ET: Jobless Claims *** 8:30 AM ET: Export Sales 10:30 AM ET: EIA Natural Gas Report * 2:00 PM ET: Treasury Statement 4:30 PM ET: Fed Balance Sheet * |
| Friday, August 11th | 8:30 AM ET: PPI-Final Demand *** 10:00 AM ET: Consumer Sentiment * 12:00 PM ET: USDA Supply/Demand - Wheat, Corn, Soybean, Cotton *** 12:00 PM ET: Crop Production 1:00 PM ET: Baker Hughes Rig Count |
*** Market Moving Indicators
* Merit Extra Attention
Commentary: At first glance, the economic report schedule looks lighter than normal, but don’t let that fool you. The twin bills of Consumer Price Index (CPI) and Producer Price Index (PPI) on Thursday and Friday will be the first data points that market participants use to grade the Fed after the last FOMC meeting.
CPI arrives at the same time as jobless claims, so watch for an increase in volatility 8:30 AM ET Thursday in all markets. The EIA Petroleum Status report on Thursday could be a market mover, as recent reports and OPEC members’ statements suggest a supply/demand struggle could be in play for WTI Crude Oil.
In agricultural news, the World Agricultural Supply/Demand Estimates (WASDE) are reported at noon ET on Friday, which also could move the wheat, corn, soybean and cotton markets. Wholesale Inventories and International Trade reports on Tuesday shed light on the global goods and services markets – another piece of the economic puzzle. Be aware that while the Fed speakers don’t always share their speaking schedule, they can speak at anytime in different media and venues, and could give insight into future Fed activity and attitudes with respect to the economy.
Ready For More?
Learn the basics of technical analysis with our free multi-video trading course, “Technical Analysis Made Easy.”
Join our daily livestream events as we prepare, analyze and trade the futures markets in real time.
Start Trading Futures With NinjaTrader
NinjaTrader supports more than 800,000 futures traders worldwide with our award-winning trading platforms, world-class support and futures brokerage services with $50 day trading margins. The NinjaTrader desktop platform is always free to use for advanced charting, strategy backtesting, technical analysis and trade simulation.
Get to know our:
- Futures brokerage: Open an account size of your choice—no deposit minimum required—and get free access to our desktop, web and mobile trading platforms.
- Free trading simulator: Sharpen your futures trading skills and test your ideas risk-free in our simulated trading environment with 14 days of livestreaming futures market data.
Better futures start now. Open your free account to access NinjaTrader’s award-winning trading platforms, plus premium training and exclusive daily market commentary.

