In this week’s coverage, we analyze the bullish trends in E-mini Dow Jones and Japanese yen futures, the bearish trend in heating oil futures, and the pullback in silver futures. We also examine the economic reports expected next week.
Commentary and charts reflect data at the time of writing. Market conditions are subject to change and may not reflect all market activity.
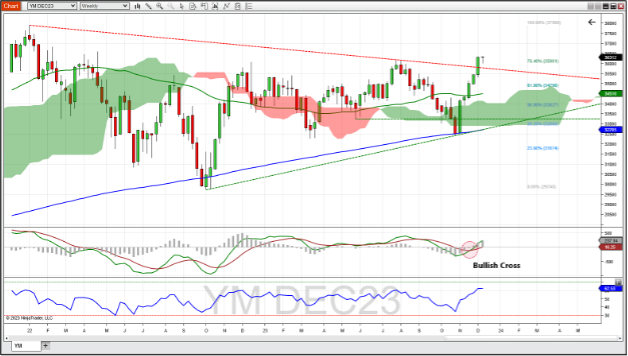
December E-mini Dow Jones Index Futures Weekly Chart
December E-mini Dow Jones Index futures continued the uptrend that saw a break above the resistance line formed by connecting the high in January 2022 with the high in July 2023. While the Dow traded down to the 76.4% Fibonacci retracement level last week, buyers pushed the price back near the open for the week. This could be just a pause in the uptrend, or the first two bars of the three-bar evening star reversal pattern. With CPI, PPI, and a Fed announcement next week, there are certainly enough possible catalysts to turn this market to the bearish side. The MACD showed a bullish cross about a month ago and is not indicating a slowdown in momentum. The RSI at 62 indicates that there still may be room for price to continue bullish. Should the uptrend continue, a possible target (and resistance is the previous high of 37,906. A reverse to the downside might see the 61.8% Fibonacci retracement level (34,790) as support.

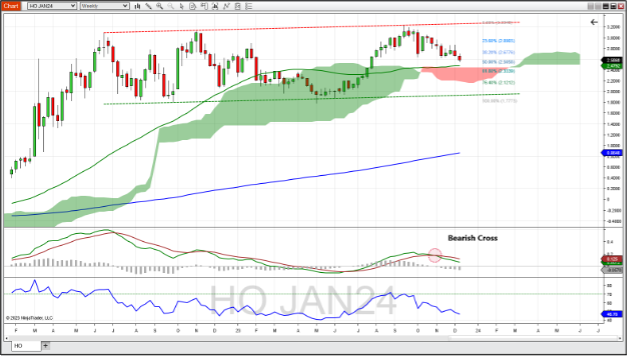
January Heating Oil Futures Weekly Chart
January heating oil futures continued the downward trend that began in mid-September, finding support at the 50% Fibonacci retracement level of the previous uptrend that began in March of this year. Heating oil finished the week halfway between the upper and lower bounds of a trend channel that has been evident since September 2022. Since the MACD showed a bearish cross at the end of October, it has continued its downward trend but has yet to cross into negative territory, indicating that this trend has room to run. RSI is now trading in line with price after showing a little bit of divergence in August to September. Should this trend continue, you can look for support at the 52-week moving average (~2.4800) and the top of the Ichimoku cloud (2.4434). A reversal to the upside might find resistance at the 38.2% fib level and further on up at the 23.6% fib level (2.6776).

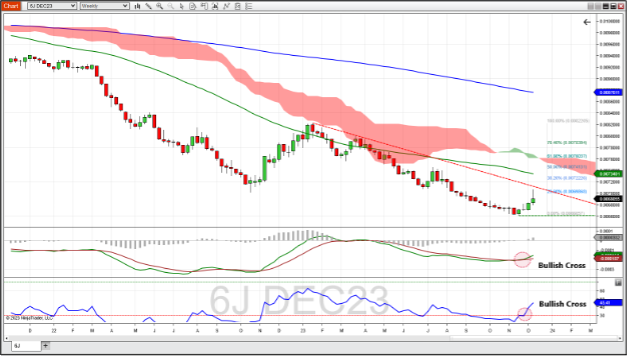
December Japanese Yen Futures Weekly Chart
December Japanese yen futures continue to rally last week, peaking above the 23.6% Fibonacci retracement level of the previous trend, which started in January this year. Last week's high approached the resistance line formed by connecting the highs in January and March of this year before sellers pushed the yen back down. Early on in this rally, we saw MACD show a bullish cross (the MACD line crossed above its signal line) and the RSI also showed a bullish cross when it crossed above the oversold line of 30. If this bullish trend continues, expect resistance at the 38.2% Fib level (0.00772226) and above that the 52-week moving average (~0.0073350). A reverse to the downside might find support at the recent low from mid-November (0.0066057).

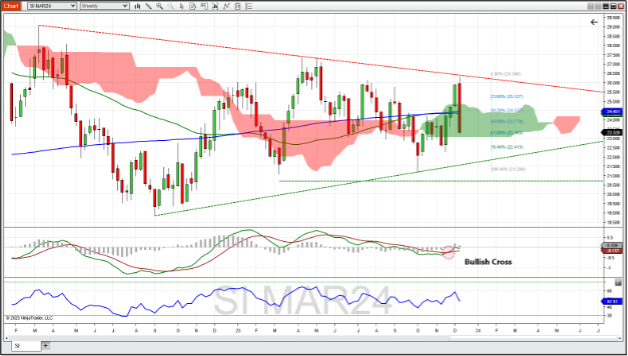
March Silver Futures Weekly Chart
March silver futures had a huge reversal last week forming a bearish engulfing candle, superseding not just the previous week's candle but the one before that, as well. This occurred after testing the resistance line formed by connecting the highs of March 2022 and May 2023. This also brought price back into the Ichimoku cloud and below both the 52-week and 200-week moving averages, finding support at the bottom of the Ichimoku cloud. This could be considered a dominant candle as its high to low range is the greatest of any candle on the chart. The MACD recently showed a bullish cross, but turned down with the recent price activity, and RSI is following price behavior. Should this reversal continue, support might be found at the 76.4% Fibonacci retracement level (22.413). Multiple resistance levels occur if this market resumes the uptrend; first at the 50% fib level (23.770) and then at the 38% level (24.377), which could be reinforced by the 52- and 200-week moving averages.

Economic Reports for the week of December 11 – December 15
On Tuesday, the FOMC begins the two-day meeting, which culminates with the Fed’s decision on whether or not to change the current Fed target rate at 2 PM ET Wednesday. Because the CME Group’s FedWatch tool shows a 98.4% probability of no change, Fed Chair Jerome Powell’s press conference just 30 minutes after the announcement could lead to volatility in the markets.
The Consumer Price Index (CPI) and Producers Price Index (PPI) arrive at 8:30 AM ET on Tuesday and Wednesday, respectively, and could change the Fed’s outlook on rates should they come in hotter or colder than expected.
Jobless Claims on Thursday morning could also move markets if the data is contrary to the Fed’s messaging. PMI Composite Flash on Friday morning could inform on the manufacturing sector of the economy. Otherwise, this week is relatively quiet with regards to economic reports. The quiet period for the Fed ends on Thursday, so Friday might bring some unscheduled speaking engagement from the Fed governors, which could excite the market.
| Date | Economic Report |
|---|---|
| Monday, December 11 | 11:00 AM ET: Export Inspections |
| Tuesday, December 12 | 6:00 AM ET: NFIB Small Business Optimism Index 7:00 AM ET: FOMC Meeting Begins 8:30 AM ET: CPI *** 10:00 AM ET: Quarterly Services Survey 2:00 PM ET: Treasury Statement 4:30 PM ET: API Weekly Oil Stocks |
| Wednesday, December 13 | 7:00 AM ET: MBA Mortgage Applications 8:30 AM ET: PPI-Final Demand *** 10:00 AM ET: Atlanta Fed Business Inflation Expectations 10:30 AM ET: EIA Petroleum Status Report * 2:00 PM ET: FOMC Announcement *** 2:30 PM ET: Fed Chair Press Conference *** |
| Thursday, December 14 | 8:30 AM ET: Export Sales 8:30 AM ET: Jobless Claims *** 8:30 AM ET: Import and Export Prices 8:30 AM ET: Retail Sales 10:00 AM ET: Business Inventories 10:30 AM ET: EIA Natural Gas Report * 4:30 PM ET: Fed Balance Sheet |
| Friday, December 15 | 8:30 AM ET: Empire State Manufacturing Index 9:15 AM ET: Industrial Production 9:45 AM ET: PMI Composite Flash * 1:00 PM ET: Baker Hughes Rig Count |
*** Market Moving Indicators
* Merit Extra Attention
Ready For More?
Learn the basics of technical analysis with our free multi-video trading course, “Technical Analysis Made Easy.”
Join our daily livestream events as we prepare, analyze and trade the futures markets in real time.
Start Trading Futures With NinjaTrader
NinjaTrader supports more than 800,000 futures traders worldwide with our award-winning trading platforms, world-class support and futures brokerage services with $50 day trading margins. The NinjaTrader desktop platform is always free to use for advanced charting, strategy backtesting, technical analysis and trade simulation.
Get to know our:
- Futures brokerage: Open an account size of your choice—no deposit minimum required—and get free access to our desktop, web and mobile trading platforms.
- Free trading simulator: Sharpen your futures trading skills and test your ideas risk-free in our simulated trading environment with 14 days of livestreaming futures market data.
Better futures start now. Open your free account to access NinjaTrader’s award-winning trading platforms, plus premium training and exclusive daily market commentary.

