Coverage for the week of August 14th – August 18th: In this week’s coverage, we analyze the rally in the heating oil futures and the breakdowns in the E-mini S&P 500, copper and Euro FX futures. We also examine the economic reports and earnings releases expected next week.
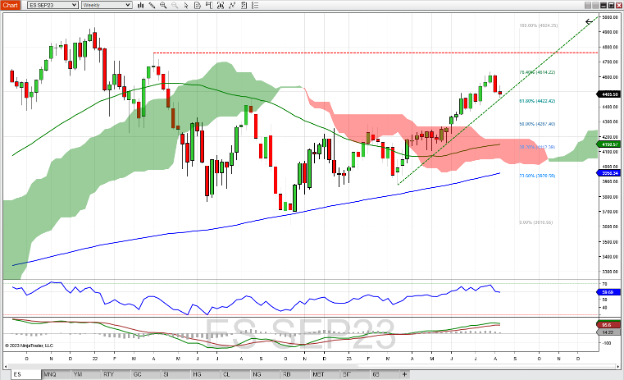
September E-Mini S&P 500 Future Weekly Chart
The September E-Mini S&P 500 future tested the upward-trending support line that began in March of this year, completing a second week that closed down from the previous week. The RSI trended down as well, falling to just under 60. The MACD, while still positive, shows signs of a weakening trend as the Histogram is turning down toward the zero line. Should the trend line hold as support and the market reverse, look for the 76% Fibonacci retracement level (~4614) to provide some possible resistance. Another resistance area might be found at 4760 – a previous high not seen since April of 2022. A continuation of the downtrend could see support at the 61.8% Fibonacci retracement level (~4422).

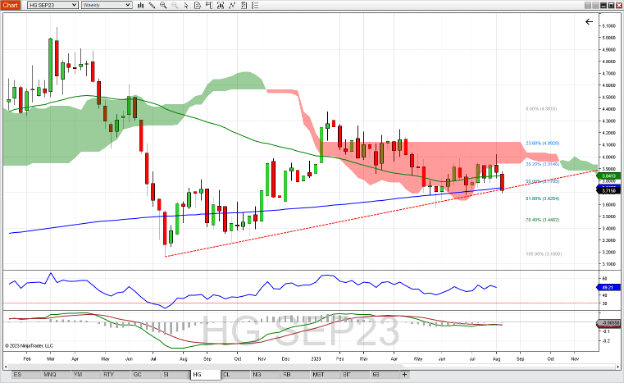
September Copper Future Weekly Chart
September copper futures broke down last week, taking out the 52-week moving average, the 200-week moving average, and the supportive trend line established from the peak lows in July and October of last year. RSI is neutral at 49, though might be showing some sign of bullish divergence, as the peak lows in RSI are increasing while the peak lows in copper are sideways. The MACD shows a slightly bearish bias as the MACD and its histogram are just below zero. Should price continue to the downside, look for the 61.8 Fibonacci retracement level of ~3.62 to act as possible support. A reverse to the upside could see resistance at ~3.77, the 50% Fib retracement level, and further resistance at the bottom of the Ichimoku cloud (~3.94).

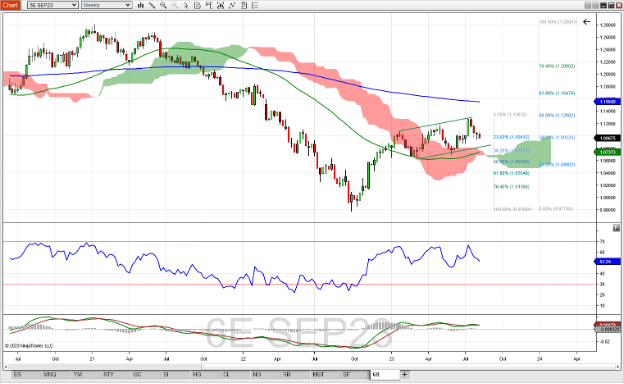
September Euro FX Future Weekly Chart
The September Euro FX future is continuing the pullback that started a month ago, testing the upper part of the trend channel that began at the start of February, before making four consecutive lower closes. Last week found support at the 23.6% Fibonacci retracement level of the up trend that started in late September 2022 and ended in July. The RSI shows some bearish divergence, as higher peak highs in the price of Euro FX align with tepid and equal peak highs in the RSI. The MACD is not helpful, as the histogram revolves very tightly around zero (typical of consolidating markets). Should the down trend continue, look for support at the lower end of the trend channel (~108) and further at ~1.0715 (the 38.2% Fib level of the recent uptrend. A reversal to the upside could find resistance at the 50% Fib retracement level of the downtrend that started in January 2021 (~1.1290).

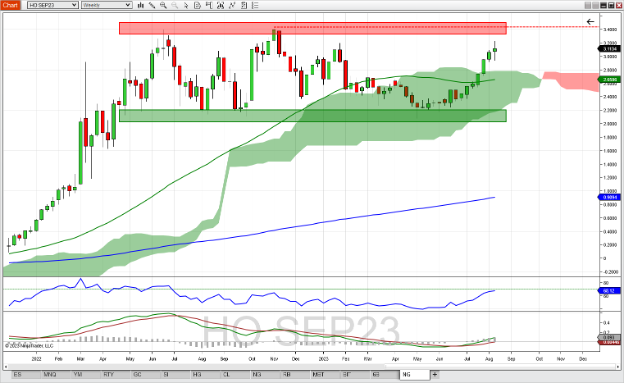
September Heating Oil Future Weekly Chart
September heating oil has been range bound between ~2.20 and ~3.40 since mid-April of 2022, after the rally that really accelerated at the beginning of the Russo-Ukrainian War. Last week saw the seventh consecutive week that heating oil closed up from the previous week – taking out the 52-week moving average and breaking out of the Ichimoku cloud. The Relative Strength Index (RSI) at ~68 is nearing the overbought level of 70. Interesting to note that while the peak high in October 2022 was higher than the previous peak high in June 2022, the RSI could not get above 70 in October (but it did in June 2022). This could be interpreted as weakness in the uptrend in October 2022 – and price did reverse shortly thereafter. A failure for the RSI to get overbought here if heating oil makes a peak high could result in a similar reversal. If that happens, look for support at the top of the Ichimoku cloud (~2.80). A continuation of the bullish trend might see resistance at the October 2022 high (~3.43).

Companies Reporting Earnings August 14th – August 18th
| Date | Companies Earnings |
|---|---|
| Monday, August 14th | Suncor Energy, Inc. (SU): $0.59 EPS Estimate, $8.27B Revenue Estimate (AMC) |
| Tuesday, August 15th | Home Depot, Inc. (HD): $4.46 EPS Estimate, $42.25B Revenue Estimate (BMO) * Agilent Technologies, Inc. (A): $1.37 EPS Estimate, $1.66B Revenue Estimate (AMC) |
| Wednesday, August 16th | Target Corp. (TGT): $1.49 EPS Estimate, $25.51B Revenue Estimate (BMO) JD.com, Inc. (JD): $0.67 EPS Estimate, $38.90B Revenue Estimate (BMO) Colgate-Palmolive Co. (CL): $0.80 EPS Estimate, $4.84B Revenue Estimate (BMO) Cisco Systems, Inc. (CSCO): $1.06 EPS Estimate, $15.05B Revenue Estimate (AMC) * |
| Thursday, August 17th | Walmart Inc. (WMT): $1.67 EPS Estimate, $159.51B Revenue Estimate (BMO) * Dole plc (DOLE): $0.37 EPS Estimate, $2.27B Revenue Estimate (BMO) Applied Materials, Inc. (AMAT): $1.73 EPS Estimate, $16.16B Revenue Estimate (AMC) |
| Friday, August 18th | Deere & Company (DE): $8.12 EPS Estimate, $14.23B Revenue Estimate (BMO) Estee Lauder Companies, Inc. (EL): ($0.04) EPS Estimate, $3.50B Revenue Estimate (BMO) |
* Indicates that this company is in the Dow Jones Index
Commentary: This week is a relatively light week for companies reporting earnings, with just over 300 companies reporting. Three companies in the Dow Jones are scheduled to report this week – Home Depot before market open on Tuesday, Cisco Systems after market close on Wednesday, and Walmart on Thursday morning.
Watch for possible market movement in Dow Futures (YM, MYM) at those times. Other retail-related companies reporting are Target and JD.com (Wednesday morning), and Estee Lauder on Friday morning. The manufacturing sector is served by earnings calls from Agilent (Tuesday), Applied Materials (Thursday) and Deere & Co. on Friday. Expect earnings season to pick up again next week as Canadian companies take center stage.
Economic Reports for the week of August 14th – August 18th
| Date | Economic Reports |
|---|---|
| Monday, August 14th | 11:00 AM ET: Export Inspections 4:00 PM ET: Crop Progress |
| Tuesday, August 15th | 9:45 AM ET: PMI Manufacturing Final * 8:30 AM ET: Import and Export Prices 8:30 AM ET: Empire State Manufacturing Index 8:30 AM ET: Retail Sales * 10:00 AM ET: Housing Market Index 10:00 AM ET: Business Inventories 4:00 PM ET: Treasury International Capital 4:30 PM ET: API Weekly Oil Stocks |
| Wednesday, August 16th | 7:00 AM ET: MBA Mortgage Applications 8:00 AM ET: Bank Reserve Settlement 8:30 AM ET: Housing Starts and Permits * 9:15 AM ET: Industrial Production 10:00 AM ET: Atlanta Fed Business Inflation Expectations 10:30 AM ET: EIA Petroleum Status Report 2:00 PM ET: FOMC Minutes *** |
| Thursday, August 17th | 8:30 AM ET: Jobless Claims *** 8:30 AM ET: Philadelphia Fed Manufacturing Index 8:30 AM ET: Export Sales 10:00 AM ET: E-Commerce Retail Sales 10:00 AM ET: Leading Indicators * 10:30 AM ET: EIA Natural Gas Report * 4:30 PM ET: Fed Balance Sheet * |
| Friday, August 18th | 10:00 AM ET: Quarterly Services Survey 1:00 PM ET: Baker Hughes Rig Count 3:00 PM ET: Cattle On Feed |
*** Market Moving Indicators
* Merit Extra Attention
Commentary: This week starts light on economic news, as the USDA provides crop progress and export inspections for the agriculture markets as the only economic reports scheduled for Monday. Tuesday ramps up with reports from the manufacturing, retail and housing sectors – keep an eye on housing as this will affect the shelter component of the Consumer Price Index (CPI), which in turn could inform us about Fed policy.
The EIA Petroleum report on Wednesday could be an influencer in the energy market, as crude oil has broken out of a resistance area and market participants might rely on flows in and out of storage to determine supply and demand of oil. The FOMC minutes on Wednesday could provide unexpected movement in stock index, gold and currency futures as it details how the different voting members of the FOMC may be aligned (or not aligned) on policy issues.
Jobless claims at 8:30 AM ET on Thursday might be a market mover, as it could tell us how the Fed is doing in avoiding a recession or getting inflation down to that 2% - 3% range. And while we don’t know when the Fed members are set to speak, be aware that comments they make in public could introduce volatility into the futures markets.
Ready For More?
Learn the basics of technical analysis with our free multi-video trading course, “Technical Analysis Made Easy.”
Join our daily livestream events as we prepare, analyze and trade the futures markets in real time.
Start Trading Futures With NinjaTrader
NinjaTrader supports more than 800,000 futures traders worldwide with our award-winning trading platforms, world-class support and futures brokerage services with $50 day trading margins. The NinjaTrader desktop platform is always free to use for advanced charting, strategy backtesting, technical analysis and trade simulation.
Get to know our:
- Futures brokerage: Open an account size of your choice—no deposit minimum required—and get free access to our desktop, web and mobile trading platforms.
- Free trading simulator: Sharpen your futures trading skills and test your ideas risk-free in our simulated trading environment with 14 days of livestreaming futures market data.
Better futures start now. Open your free account to access NinjaTrader’s award-winning trading platforms, plus premium training and exclusive daily market commentary.

