In this week’s coverage, we analyze the bearish divergence in CCI that helped signal the abrupt correction in crude oil. We will also identify and dissect the head and shoulders pattern that has formed on the daily chart of the E-mini S&P 500, as well as examine the strong move in interest rate yields, and finally we will look at the downturn in gold futures prices from their highs in early June. We also examine the economic reports expected next week.
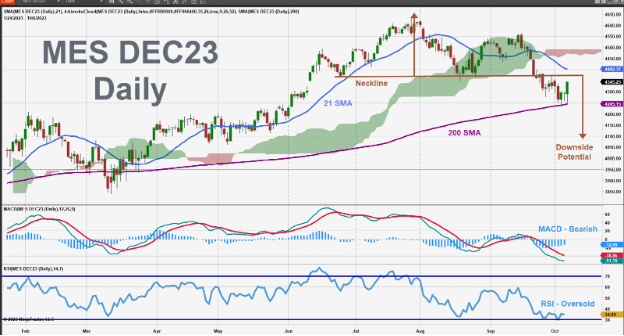
December MES E-Mini S&P 500 Futures – Daily Chart
A head and shoulders pattern on the E-mini S&P 500 futures has captured the attention of many traders the past couple of weeks. Often there is a run up into the pattern and then a correction after the pattern, the potential extent of that correction can be measured by taking the distance between the top of the head and the neckline and then extending that distance down from the neckline. Putting that downside potential at around 4,100 over the next few weeks. It is interesting that 4,100 would be a 100% retracement from where this all started back in May. The 200-day SMA held as support this week and may continue to do so into next week, however, a close below that level could be a very bearish indication. RSI shows this market is oversold, but not extremely so, there is certainly room for more downside movement. MACD shows a bearish reading below 0.

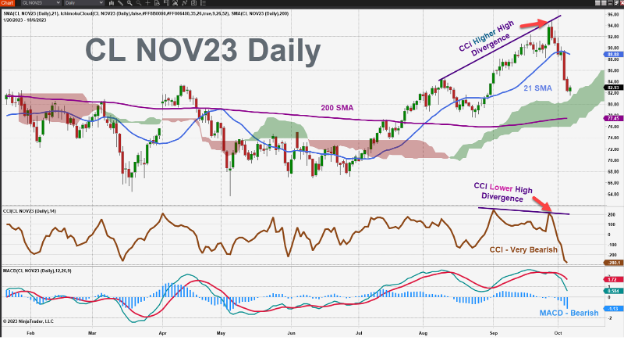
November Crude Oil Futures – Daily Chart
Late last week, a bearish divergence occurred as crude oil futures (CL) made a higher high while at the same time the CCI (Commodity Channel Index) failed to make a similar higher high and actually made a lower high. This type of bearish divergence can often signal a reversal or correction after a sustained bullish trend, and we saw that correction play out this week. This head spinning reversal also saw oil prices crossing below the 21 SMA, a bearish indication, and then approached the upper level of the Ichimoku cloud. That upper level of the cloud could be a strong support level at $82, as well as the psychological support level of $80 just below. CCI is in a very bearish oversold mode. Watch the CCI Technical Analysis Explained Replay to learn more about CCI.

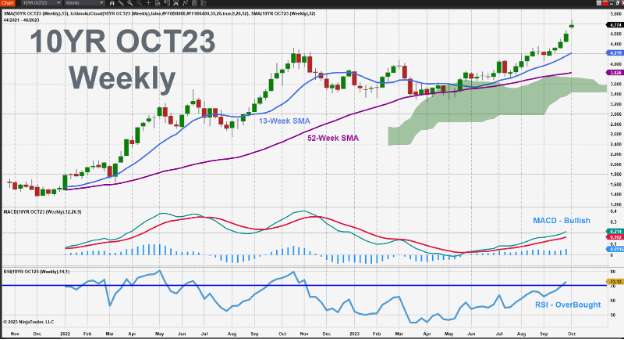
October Micro 10-YR Note Yields – Weekly Chart
The Micro 10-year note yield futures contracts have been in a strong uptrend for many weeks now, closing higher 13 out of the last 16 weeks, and driving the 10-yr note yield over 4.8%. Both the 13 week (blue) and 52 week (magenta) moving averages have a positive slope with current prices now well above those averages and the Ichimoku cloud. This market currently shows no signs of slowing down or reversing, but of course that can change on a dime. RSI moved into overbought territory this week and we'll continue to report overbought until we see a significant pullback. MACD has been bullish for the past four months and the level of bullishness is increasing as MACD continues to slope higher.

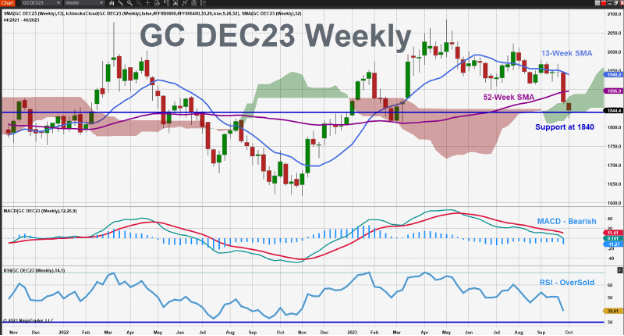
December Gold Futures – Weekly Chart
Gold continued its downtrend this week as it broke down and through the top of the Ichimoku cloud to end the week around the 1,840 support level. 1,840 is a durable support level for several reasons, it has been a strong support or resistance level with many bars straddling that level over the past two years. Currently the bottom of the Ichimoku cloud which should act as support here is also near that 1,840 level making it an especially strong level right now. Both 1,820 and 1,800 will also be strong support levels going forward the next couple weeks. RSI is slightly oversold with plenty of room to move to the downside. If we see one or two closes below 1,800, that could signal another leg down for this market. MACD has been bearish for three months and the level of bearishness accelerated last week and this week.

Companies Reporting Earnings October 9 – October 13
Earnings season kicks off this week with most of the larger companies reporting earnings Thursday and Friday. Pepsi reports Tuesday morning, then Delta, Walgreens, and Domino’s give insight into discretionary spending before market open on Thursday. Friday is mostly about the financial sector, though United Healthcare dwarfs all the other companies reporting that day in terms of revenue. Comments made by the officers from JPMorgan, Citigroup and Wells Fargo on the earnings calls may provide some insight into their outlook on the economy for this year and next.| Date | Companies Earnings |
|---|---|
| Monday, October 9 | N/A |
| Tuesday, October 10 | PepsiCo, Inc. (PEP): $2.17 EPS Estimate, $23.42B Revenue Estimate (BMO) |
| Wednesday, October 11 | N/A |
| Thursday, October 12 | Delta Airlines (DAL): $1.91 EPS Estimate, $15.10B Revenue Estimate (BMO) Walgreens Boots Alliance (WBA): $0.69 EPS Estimate, $34.61B Revenue Estimate (BMO) Domino’s Pizza, Inc. (DPZ): $3.29 EPS Estimate, $1.05B Revenue Estimate (BMO) |
| Friday, October 13 | JPMorgan Chase & Co. (JPM): $3.85 EPS Estimate, $39.00B Revenue Estimate (BMO) UnitedHealth Group, Inc. (UNH): $6.33 EPS Estimate, $91.43B Revenue Estimate (BMO) BlackRock, Inc. (BLK): $8.73 EPS Estimate, $4.67B Revenue Estimate (BMO) Citigroup, Inc. (C): $1.26 EPS Estimate, $19.34B Revenue Estimate (BMO) Wells Fargo & Co. (WFC): $1.23 EPS Estimate, $20.20B Revenue Estimate (BMO) Progressive Corp. (PGR): $1.64 EPS Estimate, $15.47B Revenue Estimate (BMO) PNC Financial Services Group, Inc. (PNC): $3.20 EPS Estimate, $5.35B Revenue Estimate (BMO) |
* indicates that this company is in the Dow Jones Index
Economic Reports for the week of October 9 – October 13
While no economic reports are due on Monday due to the Federal holiday, be aware that three Fed speakers (Barr at 8 AM, Logan at 9 AM and Jefferson at 12:50 PM ET) might make comments that may influence the markets.Three more Fed speakers on Tuesday (Bostic at 9:30 AM, Waller at 1 PM and Kashkari at 3 PM ET) compete with the NFIB Small Business Optimism Index at Wholesale Inventories. Wednesday has the weekly MBA Mortgages as usual, and the weekly API Oil Stocks report (delayed due to Monday’s holiday). Also on Wednesday, an unusual case where the Producer Price Index arrives before the Consumer Price Index (which arrives Thursday).
We’ll see if this affects market behavior like PPI normally does, or if it is more volatile than usual as it is the first of the two big inflation reports. Thursday is busy with influential reports – in addition to CPI, Jobless Claims (affecting all markets), EIA Petroleum and Natural Gas reports (affecting the energy markets) and the World Agricultural Supply/Demand Estimates (affecting agriculture markets) arrive by midday.
Friday holds some potential for market volatility with Import and Export Prices at 8:30 AM and Consumer Sentiment from the University of Michigan at 10 AM ET. Note that other Federal Reserve VIPs than those listed here may speak at conferences, luncheons, or in the media and can potentially introduce volatility with their opinions.
| Date | Economic Reports |
|---|---|
| Monday, October 9 | 6:00 AM ET: NFIB Small Business Optimism Index 9:30 AM ET: Atlanta Federal Reserve Bank President Raphael Bostic Speech 10:00 AM ET: Wholesale Inventories (Preliminary) * 11:00 AM ET: Export Inspections 1:00 PM ET: Federal Reserve Governor Christopher J. Waller Speaks 3:00 PM ET: Dallas Federal Reserve Bank President Neel Kashkari Speech 4:00 PM ET: Crop Progress |
| Tuesday, October 10 | N/A |
| Wednesday, October 11 | 7:00 AM ET: MBA Mortgage Applications 8:00 AM ET: Bank Reserve Settlement 8:30 AM ET: PPI-Final Demand * 10:00 AM ET: Atlanta Fed Business Inflation Expectations 2:00 PM ET: FOMC Minutes 4:30 PM ET: API Weekly Oil Stocks |
| Thursday, October 12 | 8:30 AM ET: Jobless Claims *** 8:30 AM ET: CPI *** 10:30 AM ET: EIA Natural Gas Report * 11:00 AM ET: EIA Petroleum Status Report * 12:00 PM ET: USDA Supply/Demand - Soybean, Cotton, Corn, Wheat *** 12:00 PM ET: Crop Production 2:00 PM ET: Treasury Statement 4:30 PM ET: Fed Balance Sheet |
| Friday, October 13 | 8:30 AM ET: Export Sales 8:30 AM ET: Import and Export Prices * 9:00 AM ET: Atlanta Federal Reserve Bank President Patrick Harker Speech 10:00 AM ET: Consumer Sentiment 1:00 PM ET: Baker Hughes Rig Count |
*** Market Moving Indicators
* Merit Extra Attention
Ready For More?
Learn the basics of technical analysis with our free multi-video trading course, “Technical Analysis Made Easy.”
Join our daily livestream events as we prepare, analyze and trade the futures markets in real time.
Start Trading Futures With NinjaTrader
NinjaTrader supports more than 800,000 futures traders worldwide with our award-winning trading platforms, world-class support and futures brokerage services with $50 day trading margins. The NinjaTrader desktop platform is always free to use for advanced charting, strategy backtesting, technical analysis and trade simulation.
Get to know our:
- Futures brokerage: Open an account size of your choice—no deposit minimum required—and get free access to our desktop, web and mobile trading platforms.
- Free trading simulator: Sharpen your futures trading skills and test your ideas risk-free in our simulated trading environment with 14 days of livestreaming futures market data.
Better futures start now. Open your free account to access NinjaTrader’s award-winning trading platforms, plus premium training and exclusive daily market commentary.

