In this week’s coverage, we analyze the pullback in heating oil futures, the bearish trend in Canadian dollar and E-mini Russell 2000 futures, and the bullish trend in gold futures. We also examine the economic and earnings reports expected next week.
Commentary and charts reflect data at the time of writing. Market conditions are subject to change and may not reflect all market activity.
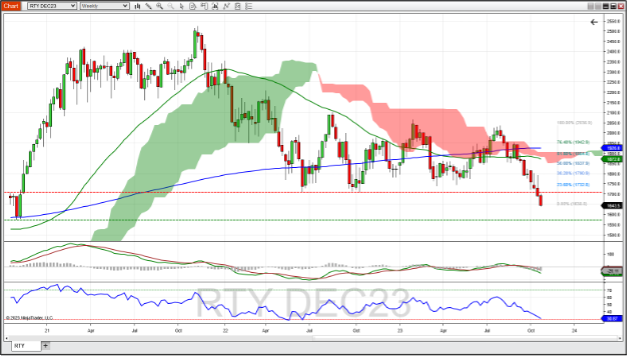
December E-Mini Russell 2000 Index Futures Weekly Chart
December E-mini Russell 2000 Index futures continued the downward slide last week, as it couldn't even test the lows found in July and October last year (~1,710). This might mark the end of range bound trading that began in the first half of 2022. Price is well below the 52- and 200-week moving averages and the Ichimoku cloud which indicates bearishness. The MACD and its histogram remains negative: another bearish indication. The RSI stopped just short of crossing below the oversold level of 30. The next level of support might be found at the October 2020 lows (~1,575). If this market rebounds, resistance might be found at the 23.6% Fibonacci retracement level as determined by the downtrend that started in early August (~1,732).

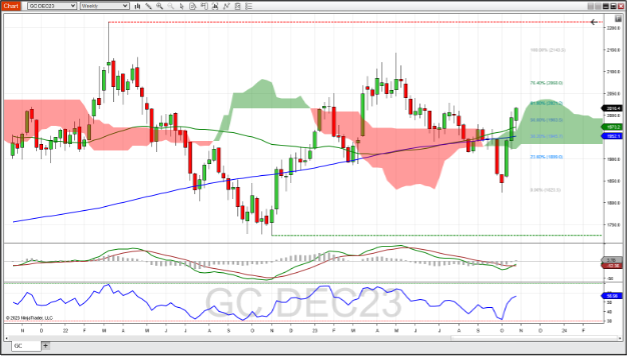
December Gold Futures Weekly Chart
December gold futures continued its third week of advancement, finding resistance at the 61.8% Fibonacci retracement level as determined by the downtrend from early May to late September this year. Gold managed to stay above the 52- and 200-week moving averages, and the Ichimoku cloud, which are bullish indications. The MACD just showed a bullish sign with a cross above the signal line, and RSI is trending in line with price. Should the trend continue, resistance might occur at the 76.4% retracement level (2,068). A reverse to the downside could see support at the 52-week moving average (~1,975) and the 200-week moving average (~1,945).

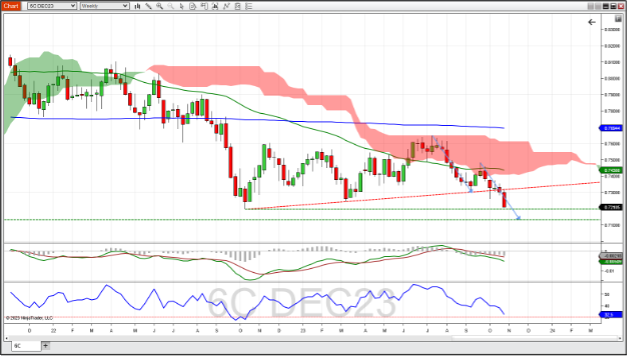
December Canadian Dollar Futures Weekly Chart
December Canadian dollar futures had their biggest move downward since the beginning of August, failing to close above a support line found by connecting Lowe's from October last year to March this year. Last week’s candle also threatened to test the low from October last year, which coincides with the symbological level of 0.7200. The recent bias is bearish also because price is trading below both the 52- and 200-week moving averages (as well as the bottom of the Ichimoku cloud). MACD is bearish as both the MACD and histogram are in negative territory. The RSI, at 32.50, is trending downward and approaching the oversold level of 30. Should this price continue a downward trend, look for support at the ABCD trend extension at 0.7135. A reversal might find resistance at the upward sloping trend line (~0.7321) and further up at the bottom of the Ichimoku cloud (~0.7410).

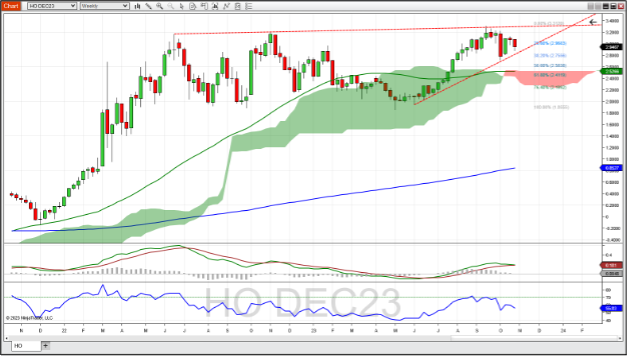
December Heating Oil Futures Daily Chart
December heating oil futures continue to pull back from recent highs back in September closing below the 23.6% Fibonacci retracement of the uptrend that started in May to the recent highs. Last week's low came close but failed to retest the bullish trend line found by connecting Lowe's from earlier this year. The MACD is poised to cross below its signal line, which could indicate the beginning of a bearish trend. The RSI is trading downward in line with price. Should this pullback continue, support could be found at the 38.2% Fibonacci retracement level (~2.75) as well as the 52-week moving average, which coincides with the top of the Ichimoku cloud (~2.5260). A reverse to the upside might find resistance at the trend line found by connecting the highs from June 2022 and September the same year (~3.30).

Companies Reporting Earnings October 30 – November 3
With over 940 companies reporting earnings next week, it's not unusual that small caps start to take the focus during earnings season. Healthcare, insurance, oil and energy, and travel and entertainment are the sectors that are highlighted this week. Companies found in the Dow Jones index include McDonald's Monday morning, Caterpillar and Amgen on Tuesday morning, and Apple on Thursday afternoon.
These reports could inject volatility in the E-mini Dow Jones futures at those times. Other tech companies reporting are AMD, PayPal and Qualcomm, all aftermarkets next week. Be aware that stock index futures could see some non-systematic trading behavior, especially before and at regular trading hours (RTH) market open, and after RTH market close.
| Date | Companies Earnings |
|---|---|
| Monday, October 30 | McDonalds Corp. (MCD): $2.99 EPS Estimate, $6.23B Revenue Estimate (BMO) * |
| Tuesday, October 31 | Pfizer, Inc. (PFE): ($0.19) EPS Estimate, $12.91B Revenue Estimate (BMO) Caterpillar, Inc. (CAT): $4.75 EPS Estimate, $16.53B Revenue Estimate (BMO) * Amgen, Inc. (AMGN): $4.65 EPS Estimate, $6.66B Revenue Estimate (BMO) * BP p.l.c. (BP): $1.37 EPS Estimate, $57.64B Revenue Estimate (BMO) Marathon Petroleum Corp. (MPC): $7.79 EPS Estimate, $40.05B Revenue Estimate (BMO) Anheuser-Busch InBev. (GM): $0.86 EPS Estimate, $15.71B Revenue Estimate (BMO) Advanced Micro Devices, Inc. (AMD): $0.68 EPS Estimate, $5.40B Revenue Estimate (AMC) |
| Wednesday, November 1 | CVS Health (CVS): $2.13 EPS Estimate, $88.26B Revenue Estimate (BMO) Humana, Inc. (HUM): $7.14 EPS Estimate, $25.55B Revenue Estimate (BMO) Kraft Heinz Company (KHC): $0.66 EPS Estimate, $6.71B Revenue Estimate (BMO) Sunoco, Inc. (SUN): $1.11 EPS Estimate, $5.54B Revenue Estimate (BMO) PayPal (PYPL): $1.23 EPS Estimate, $7.01B Revenue Estimate (AMC) QUALCOMM Incorporated (QCOM): $1.80 EPS Estimate, $8.08B Revenue Estimate (AMC) Allstate Corp. (ALL): $0.39 EPS Estimate, $13.18B Revenue Estimate (AMC) AFLAC, Inc. (AFL): $1.47 EPS Estimate, $4.33B Revenue Estimate (AMC) Metlife Inc. (MET): $2.02 EPS Estimate, $17.68B Revenue Estimate (AMC) American International Group, Inc. (AIG): $1.55 EPS Estimate, $12.56B Revenue Estimate (AMC) |
| Thursday, November 2 | Eli Lilly & Co. (LLY): ($0.11) EPS Estimate, $8.88B Revenue Estimate (BMO) ConocoPhillips (COP): 2.04 EPS Estimate, $14.09B Revenue Estimate (BMO) Marriott International Inc. (MAR): $2.10 EPS Estimate, $5.89B Revenue Estimate (BMO) Shell plc (SHEL): $1.85 EPS Estimate, $82.96 B Revenue Estimate (BMO) Hyatt Hotels Corp (HON): $0.60 EPS Estimate, $1.64B Revenue Estimate (BMO) Apple, Inc. (AAPL): $1.39 EPS Estimate, $84.69B Revenue Estimate (AMC) * Starbucks Corp. (SBUX): $0.97 EPS Estimate, $8.81B Revenue Estimate (AMC) |
| Friday, November 3 | N/A |
* indicates that this company is in the Dow Jones Index
Economic Reports for the week of October 30 – November 3
With the CME FedWatch tool showing a 97.4% probability that the Fed will keep rates the same, look for Federal Reserve Chair Jerome Powell's news conference at 2:30 PM ET on Wednesday to have the potential to introduce volatility in the markets.
Manufacturing reports are released every day, with the Dallas Fed survey on Monday, Chicago PMI on Tuesday, ISM Manufacturing and Construction Spending on Wednesday, Factory Orders on Thursday and PMI Composite Final on Friday.
The labor market should be well defined as well, with ADP Employment and JOLTS on Wednesday, Challenger Job Cuts and Jobless Claims on Thursday, and the Employment Situation on Friday, all before market open.
The housing market is represented also with FHFA House Prices and Case Shiller Home Prices on Tuesday morning and MBA Mortgage Applications on Wednesday morning. The weekly EIA Natural Gas report On Thursday might have a little more weight as we head into the winter months. The Fed blackout period ends with Michael Barr speaking at 8:00 AM Friday morning. Be aware that other Federal Reserve presidents and governors could speak without advance notice, and that their comments can be influential.
| Date | Economic Reports |
|---|---|
| Monday, October 30 | 10:30 AM ET: Dallas Fed Manufacturing Survey * 11:00 AM ET: Export Inspections 4:00 PM ET: Crop Progress |
| Tuesday, October 31 | 8:00 AM ET: FOMC Meeting Begins 8:30 AM ET: Employment Cost Index 9:00 AM ET: FHFA House Price Index 9:00 AM ET: Case-Shiller Home Price Index 9:45 AM ET: Chicago PMI 10:00 AM ET: Consumer Confidence 3:00 PM ET: Farm Prices 4:30 PM ET: API Weekly Oil Stocks |
| Wednesday, November 1 | 7:00 AM ET: MBA Mortgage Applications 8:15 AM ET: ADP Employment Report 9:45 AM ET: PMI Manufacturing Final 10:00 AM ET: JOLTS * 10:00 AM ET: ISM Manufacturing Index 10:00 AM ET: Construction Spending 10:30 AM ET: EIA Petroleum Status Report 2:00 PM ET: FOMC Announcement *** 2:30 PM ET: Fed Chair Jerome Powell Press Conference *** 3:00 PM ET: Grain Crushings 3:00 PM ET: Fats & Oils |
| Thursday, November 2 | 7:30 AM ET: Challenger Job-Cut Report 8:00 AM ET: Motor Vehicle Sales 8:30 AM ET: Export Sales 8:30 AM ET: Productivity and Costs 8:30 AM ET: Jobless Claims 10:00 AM ET: Factory Orders 10:30 AM ET: EIA Natural Gas Report 4:30 PM ET: Fed Balance Sheet |
| Friday, November 3 | 8:00 AM ET: Federal Reserve Vice Chair Michael Barr Speech *** 8:30 AM ET: Employment Situation *** 9:45 AM ET: PMI Composite Final * 10:00 AM ET: ISM Services Index * 1:00 PM ET: Baker Hughes Rig Count |
*** Market Moving Indicators
* Merit Extra Attention
Ready For More?
Learn the basics of technical analysis with our free multi-video trading course, “Technical Analysis Made Easy.”
Join our daily livestream events as we prepare, analyze and trade the futures markets in real time.
Start Trading Futures With NinjaTrader
NinjaTrader supports more than 800,000 futures traders worldwide with our award-winning trading platforms, world-class support and futures brokerage services with $50 day trading margins. The NinjaTrader desktop platform is always free to use for advanced charting, strategy backtesting, technical analysis and trade simulation.
Get to know our:
- Futures brokerage: Open an account size of your choice—no deposit minimum required—and get free access to our desktop, web and mobile trading platforms.
- Free trading simulator: Sharpen your futures trading skills and test your ideas risk-free in our simulated trading environment with 14 days of livestreaming futures market data.
Better futures start now. Open your free account to access NinjaTrader’s award-winning trading platforms, plus premium training and exclusive daily market commentary.

