Coverage for the week of September 11 – September 15: In this week’s coverage, we analyze the downtrends in the E-mini S&P 500, Japanese yen and silver futures, and the rally in RBOB gasoline futures. We also examine the economic reports expected next week.
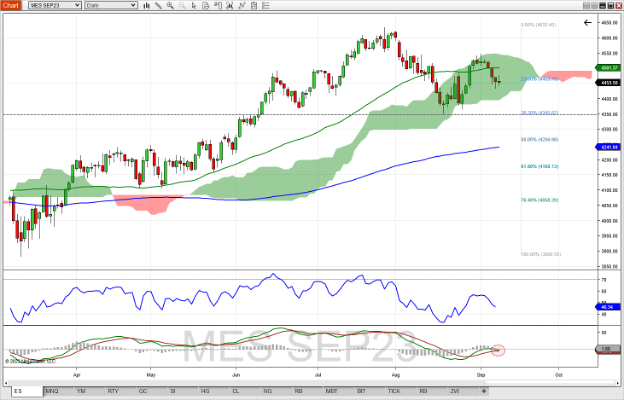
September E-Mini S&P 500 Index Futures Daily Chart
September E-mini S&P 500 Index futures were down for the week, crossing below the 50-day moving average, which can be interpreted as a bearish signal. Friday's positive move resulted in a bullish harami pattern at the 23.6% Fibonacci retracement level (determined by the uptrend which started in March and completed at the end of July). RSI is trading along with price, and the MACD is poised to cross below its signal line, which can be considered a bearish signal. Should the E-mini S&P follow the MACD’s lead, support might be found at the bottom of the Ichimoku cloud (~4,405) and further down at the 38.2% retracement level which coincides with the low seen in mid-August (~43.45). If the current pause turns into a rally, look for resistance at the 50-day moving average (~4,500) and further up at the top of the Ichimoku cloud (~4,540).

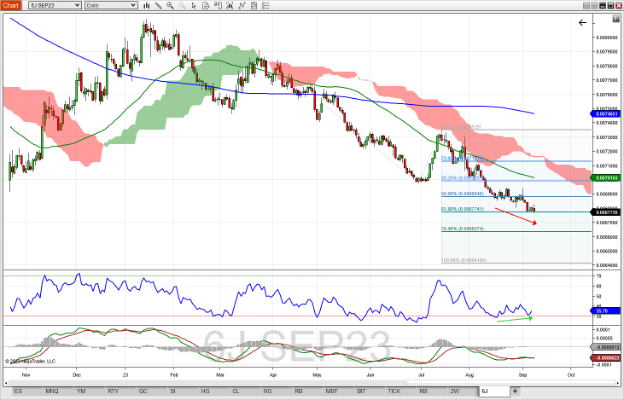
September Japanese Yen Futures Daily Chart
September Japanese yen futures continued their bearish trend, finding support at 0.006770. This level corresponds with the 61.8% Fibonacci Extension level, as determined by the previous downtrend. Price is well below the 50- and 200-day moving averages as well as the bottom of the Ichimoku cloud. The MACD is below zero, indicating a bearish state, but doesn't give clear direction on a change of momentum as it is wrapped up with its signal line. While the RSI is near oversold levels, bullish divergence appears to be evident as peak lows in the RSI appear to be increasing as peak lows in price are decreasing. This may indicate a reversal to the upside is near. Should this downtrend continue, support might be found at the 76.4% Fib Extension level (~0.00663). A reverse to the upside could find resistance at the 50% Fib Extension level (~0.00688.)

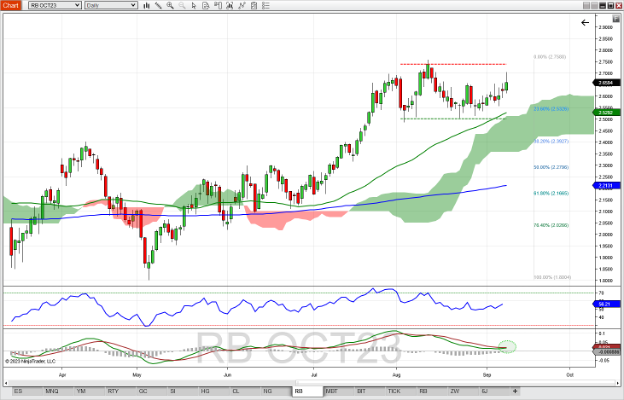
October RBOB Gasoline Futures Daily Chart
October RBOB gasoline futures remain range bound since the beginning of August, after a midsummer bullish run. Last week's short-term rally brought the high near the top of the range until sellers pushed back, though the week still finished positive. Gasoline futures are still above the 50- and 200-day moving averages as well as the Ichimoku cloud, which is a bullish state. The RSI is trending up with price and while it looks like there might be bearish divergence right now, let's wait to see where the current trend ends before we make that determination. The MACD is poised to cross up, which could be interpreted as a bullish trigger. Should the uptrend continue, look for resistance at the top of the range (~2.75). A pullback might find support at the 23.6% Fibonacci level and the 50-day moving average(~2.53), and further down at the bottom of the trading range (~2.50).

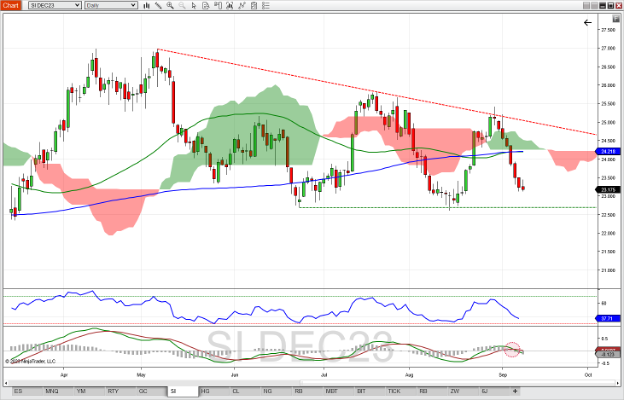
December Silver Futures Daily Chart
December silver futures finished last week with their eighth consecutive down day after testing upside resistance as determined by previous peak highs in May and July. This bullish trend pushed silver prices down below both its 50-day and 200-day moving averages, while breaking through the bottom side of the Ichimoku cloud. The RSI is trending along with price, and the MACD indicator showed a bearish signal midweek, when the MACD crossed its signal line to the downside. Should this bearish trend continue, support might be found at previous areas of support in June and August, at ~22.70. Possible resistance might be found at the comingling of the 50- and 200-day moving average as well as the bottom of the Ichimoku cloud, in the 24.20 – 24.22 area.

Commentary: Agriculture reports take the spotlight with the weekly Export Inspections and Crop Progress reports on Monday, followed by the World Agricultural Supply and Demand Estimates (WASDE) report releasing at noon ET on Tuesday.
The Supply/Demand report covers wheat, corn, soybeans, cotton, rice, sugar, meat, eggs and milk, and has the potential to introduce volatility to intraday trading in those futures markets. Consumer Price Index (CPI) on Wednesday morning is the main event for stock index, currency and gold futures, with Producers Price Index (PPI) following a day later – also a possible market mover, as these reports give insight into the inflation picture that the Fed is concerned with.
Jobless Claims drops at the same time as PPI, which could have an exacerbating or muting effect on the PPI report. Friday finishes the week with two reports related to the manufacturing side of the economy: the Empire State Manufacturing Index (8:30 AM ET) and Industrial Production (9:15 AM ET). Ahead of the September 20 FOMC meeting, Fed speakers will be silent as they respect the Blackout period that started September 9 and runs through September 21.
Economic Reports for the week of September 11 – September 15
| Date | Economic Reports |
|---|---|
| Monday, September 11 | 11:00 AM ET: Export Inspections 4:00 PM ET: Crop Progress |
| Tuesday, September 12 | 6:00 AM ET: NFIB Small Business Optimism Index 12:00 PM ET: USDA Supply/Demand - Corn, Cotton, Soybean, Wheat *** 12:00 PM ET: Crop Production *** 4:30 PM ET: API Weekly Oil Stocks |
| Wednesday, September 13 | 7:00 AM ET: MBA Mortgage Applications 8:00 AM ET: Bank Reserve Settlement 8:30 AM ET: CPI *** 10:00 AM ET: Atlanta Fed Business Inflation Expectations 10:30 AM ET: EIA Petroleum Status Report * |
| Thursday, September 14 | 8:30 AM ET: Jobless Claims *** 8:30 AM ET: Export Sales 8:30 AM ET: Retail Sales 8:30 AM ET: PPI-Final Demand * 10:00 AM ET: Business Inventories 10:30 AM ET: EIA Natural Gas Report * 4:30 PM ET: Fed Balance Sheet |
| Friday, September 15 | 8:30 AM ET: Empire State Manufacturing Index 8:30 AM ET: Import and Export Prices 9:15 AM ET: Industrial Production 10:00 AM ET: Consumer Sentiment * 1:00 PM ET: Baker Hughes Rig Count |
*** Market Moving Indicators
* Merit Extra Attention
Ready For More?
Learn the basics of technical analysis with our free multi-video trading course, “Technical Analysis Made Easy.”
Join our daily livestream events as we prepare, analyze and trade the futures markets in real time.
Start Trading Futures With NinjaTrader
NinjaTrader supports more than 800,000 futures traders worldwide with our award-winning trading platforms, world-class support and futures brokerage services with $50 day trading margins. The NinjaTrader desktop platform is always free to use for advanced charting, strategy backtesting, technical analysis and trade simulation.
Get to know our:
- Futures brokerage: Open an account size of your choice—no deposit minimum required—and get free access to our desktop, web and mobile trading platforms.
- Free trading simulator: Sharpen your futures trading skills and test your ideas risk-free in our simulated trading environment with 14 days of livestreaming futures market data.
Better futures start now. Open your free account to access NinjaTrader’s award-winning trading platforms, plus premium training and exclusive daily market commentary.

