In this week’s coverage, we analyze the pullback in Nasdaq 100 futures, the bearish trend in British pound futures, and the rallies in RBOB gasoline and Micro bitcoin futures. We also examine the economic and earnings reports expected next week.
Commentary and charts reflect data at the time of writing. Market conditions are subject to change and may not reflect all market activity.
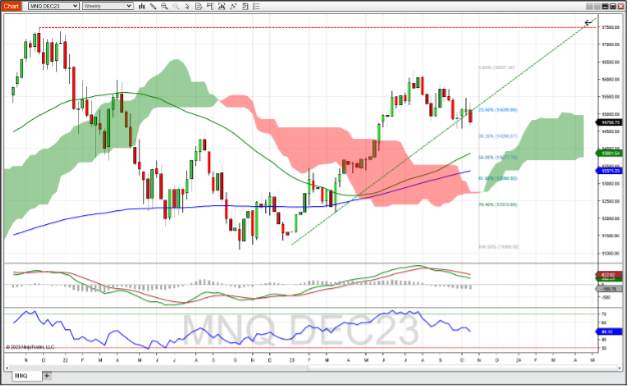
December Micro Nasdaq 100 Index Futures Weekly Chart
December Micro Nasdaq 100 Index futures finish the week bearish, closing below the 23.6% Fibonacci retracement level from the previous uptrend that began in December 2022 and ended in July 2023. This bearish move also broke through the supporting trend line established by connecting lows from December 2022 and March 2023. Nasdaq futures are certainly the strongest of the US stock index futures with prices remaining well above the 52-week and 200-week moving averages, and the top of the Ichimoku cloud. The MACD indicator gave a bearish signal back in August as the MACD crossed below its signal line. RSI just broke below 50 and is trending downward along with price. Should this bearish trend continue, support might be found at the 38.2% Fib level (~14,290) and beyond that the 52-week moving average (~13,900). If the market turns around, expect some resistance at 23.6% Fib level (~15,040) which would be just shy of that bullish trend line.

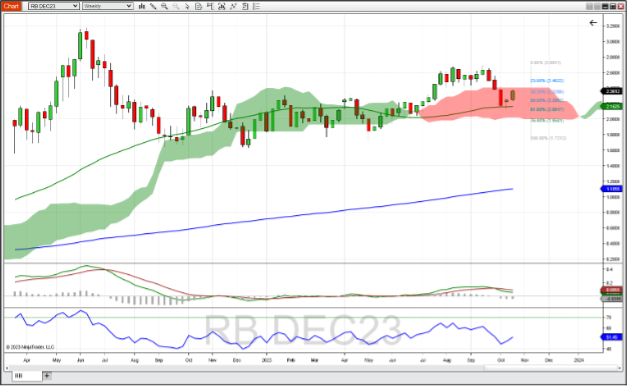
December RBOB Gasoline Futures Weekly Chart
December RBOB gasoline futures continued the rally after finding support at the 52-week moving average. That bounce occurred at the 61.8% Fibonacci retracement level of the previous bullish trend that started in May and terminated in mid-September. Gasoline closed above the 38.2% Fib retracement level last week, with the top of the Ichimoku cloud acting as resistance. The RSI bounced above 50 (which is a neutral reading) and is trending in line with price. While the MACD is still positive, the negative MACD histogram indicates bearishness. These conflicting indications reflect the range bound trend that gasoline has been in since September of last year period. A continuation of this bullish bounce might find resistance at the 23.6% retracement level (~2.46). A reverse to the downside could find support at the 52-week moving average (~2.16) and the bottom of the Ichimoku cloud (~2.00).

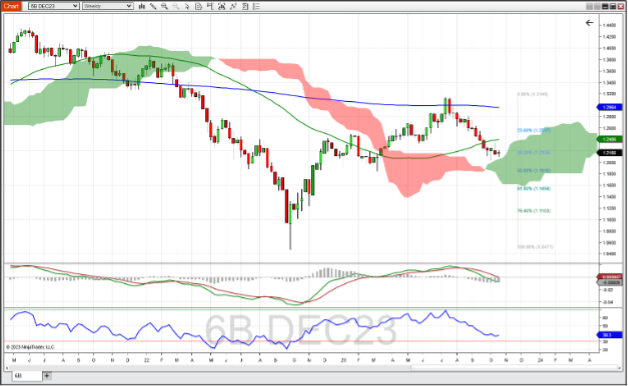
December British Pound Futures Weekly Chart
December British pound futures continued the downward trend that began mid-July this year. The doji suggests that neither buyers nor sellers advanced last week. The top of the Ichimoku cloud and a 38.2 Fibonacci retracement level of the uptrend that began in September last year and terminated in July acted as support last week. RSI shows a longer-term weakening trend, but that there is still room to go to reach oversold condition of 30 or less. The MACD histogram gave a bearish signal in mid-August, and the MACD turned negative one month ago; with the signal line poised to cross below the zero-line MACD could be considered in a definitively bearish state. Should this market rebound, you might expect resistance at the 52-week moving average (~1.24). If it continues its downward trajectory, anticipate support at the top of the Ichimoku cloud and at the 50% Fib retracement mark.

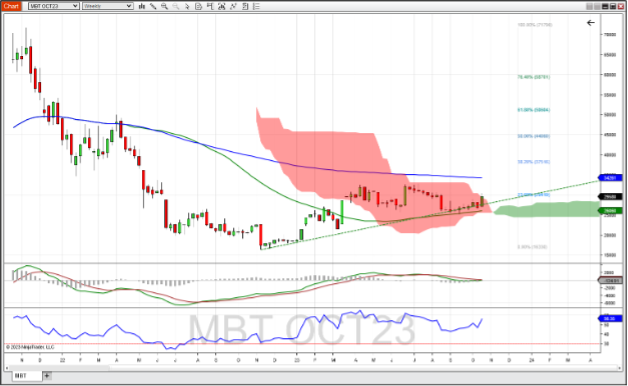
October Micro Bitcoin Futures Daily Chart
October Micro bitcoin futures had a strong bullish move last week, as news around regulation of crypto ETFs surfaced. Bitcoin closed above the 23.6% Fibonacci retracement level of the downward trend that began in November 2021 and finished in November 2022. Last week's bullish action kept bitcoin above its 52-week moving average and above the bullish trend line established by connecting peak lows from November 2022 and January 2023. Friday's close also put bitcoin above the Ichimoku cloud, which is a bullish indication. RSI trends up with price but has room to go to get overbought. MACD is poised to cross above its signal line and the zero line, which both would be bullish indications should they occur. Should this rally continue resistance might be found at the 200-week moving average (~34,260). A reversal to the downside might find support at the 52-week moving average, which coincides with the bottom of the Ichimoku cloud (~25,570).

Companies Reporting Earnings October 23 – October 27
Earnings focus switches from financial companies to tech and oil companies this week. Microsoft and Alphabet (formally known as Google) report after market close on Tuesday; IBM and Meta (formally known as Facebook) report on Wednesday afternoon; and Amazon takes the tech spotlight on Thursday aftermarkets.
IBM and Microsoft may get a boost as AI seems to be driving tech these days. These results could introduce volatility in S&P 500 and Nasdaq 100 futures after market close on those days. Friday morning before the market open, earnings reports come from ExxonMobil, Chevron, and Phillips 66. Crude oil traders should pay attention to what these oil companies are saying about supply going into 2024.
The Dow Jones Index companies are represented well this week with a third of the stocks in the Dow reporting. Tuesday is a big day for Dow Index futures with four companies reporting before market open and two reporting after market close. Results from these reports could potentially influence YM futures to trend differently from the other stock index futures. Other big names to look out for on Thursday: UPS and Comcast in the morning, and Ford Motor Company and US Steel in the afternoon.
| Date | Companies Earnings |
|---|---|
| Monday, October 23 | Royal Philips (PHG): $0.33 EPS Estimate, $4.66B Revenue Estimate (BMO) |
| Tuesday, October 24 | Coca-Cola Company (KO): $0.69 EPS Estimate, $11.46B Revenue Estimate (BMO) * Verizon Communications (VZ): $1.17 EPS Estimate, $33.39B Revenue Estimate (BMO) * General Electric Co. (GE): $0.56 EPS Estimate, $15.70B Revenue Estimate (BMO) 3M Company (MMM): $2.34 EPS Estimate, $7.96B Revenue Estimate (BMO) * Archer-Daniels-Midland Co. (ADM): $1.52 EPS Estimate, $24.17B Revenue Estimate (BMO) General Motors Corp. (GM): $1.84 EPS Estimate, $43.83B Revenue Estimate (BMO) Dow Chemical Co. (DOW): $0.43 EPS Estimate, $10.38B Revenue Estimate (BMO) * Xerox Corp. (XRX): $0.33 EPS Estimate, $1.72B Revenue Estimate (BMO) Microsoft Corp. (MSFT): $2.65 EPS Estimate, $54.49B Revenue Estimate (AMC) * Alphabet Inc. (GOOGL): $1.45 EPS Estimate, $75.91B Revenue Estimate (AMC) Visa (V): $2.23 EPS Estimate, $8.56B Revenue Estimate (AMC) * |
| Wednesday, October 25 | Boeing Co. (BA): ($2.89) EPS Estimate, $18.27B Revenue Estimate (BMO) * T-Mobile US Inc. (TMUS): $1.75 EPS Estimate, $19.35B Revenue Estimate (BMO) Meta Platforms, Inc. (META): $3.57 EPS Estimate, $33.52B Revenue Estimate (AMC) International Business Machines Corp. (IBM): $2.12 EPS Estimate, $14.79B Revenue Estimate (AMC) |
| Thursday, October 26 | United Parcel Service, Inc. (UPS): $1.60 EPS Estimate, $21.64B Revenue Estimate (BMO) Merck & Co., Inc. (MRK): $1.94 EPS Estimate, $15.33B Revenue Estimate (BMO) * Southwest Airlines Co. (LUV): $0.40 EPS Estimate, $6.56B Revenue Estimate (BMO) Comcast Corp. (CMCSA): $0.94 EPS Estimate, $29.72B Revenue Estimate (BMO) Honeywell International, Inc. (HON): $2.22 EPS Estimate, $9.23B Revenue Estimate (BMO) * Amazon.com, Inc. (AMZN): $0.58 EPS Estimate, $141.47B Revenue Estimate (AMC) Ford Motor Company (F): $0.40 EPS Estimate, $40.11B Revenue Estimate (AMC) United States Steel (X): $1.11 EPS Estimate, $4.39B Revenue Estimate (AMC) |
| Friday, October 27 | Exxon Mobil Corp. (XOM): $2.38 EPS Estimate, $88.56B Revenue Estimate (BMO) AbbVie Inc. (ABBV): $2.85 EPS Estimate, $13.69B Revenue Estimate (BMO) Chevron Corporation (CVX): $3.59 EPS Estimate, $50.24B Revenue Estimate (BMO) * Phillips 66 (PSX): $4.97 EPS Estimate, $38.96B Revenue Estimate (BMO) * indicates that this company is in the Dow Jones Index |
* indicates that this company is in the Dow Jones Index
Economic Reports for the week of October 23 – October 27
Manufacturing gets a bid this week as we see reports covering the Chicago Fed National Activity Index on Monday, the Richmond Fed and PMI Composite Flash on Tuesday, and Kansas City Fed Manufacturing on Thursday.
A couple of sentiment reports come this week: Business Uncertainty on Wednesday morning, and Consumer Sentiment from the University of Michigan Friday morning. The reports with the biggest impact could come Thursday morning at 8:30 am ET as Jobless Claims, Durable Goods Orders, and GDP all drop at the same time.
International Trade in Goods and Inventory Data drops at that time too. Another impactful report could be the Personal Income and Outlays on Friday morning at 8:30 AM ET as that is a portion of the inflation picture that Fed members are said to be watching closely. Ahead of the November 1 FOMC meeting, Fed speakers will be silent as they respect the blackout period that started October 21 and runs through November 2.
| Date | Economic Reports |
|---|---|
| Monday, October 23 | 8:30 AM ET: Chicago Fed National Activity Index 11:00 AM ET: Export Inspections 4:00 PM ET: Crop Progress |
| Tuesday, October 24 | 9:45 AM ET: PMI Composite Flash * 10:00 AM ET: Richmond Fed Manufacturing Index 1:00 PM ET: Money Supply 4:30 PM ET: API Weekly Oil Stocks |
| Wednesday, October 25 | 7:00 AM ET: MBA Mortgage Applications 8:00 AM ET: Bank Reserve Settlement 10:00 AM ET: New Home Sales 10:30 AM ET: EIA Petroleum Status Report * 11:00 AM ET: Survey of Business Uncertainty 3:00 PM ET: Cold Storage |
| Thursday, October 26 | 8:30 AM ET: Export Sales 8:30 AM ET: Jobless Claims *** 8:30 AM ET: International Trade in Goods [Advance] 8:30 AM ET: Durable Goods Orders 8:30 AM ET: GDP *** 8:30 AM ET: Wholesale Inventories (Advance) 8:30 AM ET: Retail Inventories (Advance) 10:00 AM ET: Pending Home Sales Index 10:30 AM ET: EIA Natural Gas Report * 11:00 AM ET: Kansas City Fed Manufacturing Index 4:30 PM ET: Fed Balance Sheet |
| Friday, October 27 | 8:30 AM ET: Personal Income and Outlays *** 10:00 AM ET: Consumer Sentiment * 1:00 PM ET: Baker Hughes Rig Count |
*** Market Moving Indicators
* Merit Extra Attention
Ready For More?
Learn the basics of technical analysis with our free multi-video trading course, “Technical Analysis Made Easy.”
Join our daily livestream events as we prepare, analyze and trade the futures markets in real time.
Start Trading Futures With NinjaTrader
NinjaTrader supports more than 800,000 futures traders worldwide with our award-winning trading platforms, world-class support and futures brokerage services with $50 day trading margins. The NinjaTrader desktop platform is always free to use for advanced charting, strategy backtesting, technical analysis and trade simulation.
Get to know our:
- Futures brokerage: Open an account size of your choice—no deposit minimum required—and get free access to our desktop, web and mobile trading platforms.
- Free trading simulator: Sharpen your futures trading skills and test your ideas risk-free in our simulated trading environment with 14 days of livestreaming futures market data.
Better futures start now. Open your free account to access NinjaTrader’s award-winning trading platforms, plus premium training and exclusive daily market commentary.

