Coverage for the week of April 10th - April 14th: With Good Friday this week making for a short week, our analysts provided insight into what to expect for E-Mini S&P 500 futures, crude oil futures, gold futures and euro FX futures. Take your futures trading to the next level by checking in for our weekly technical trends blog posts!
E-Mini S&P 500 Future Weekly Chart
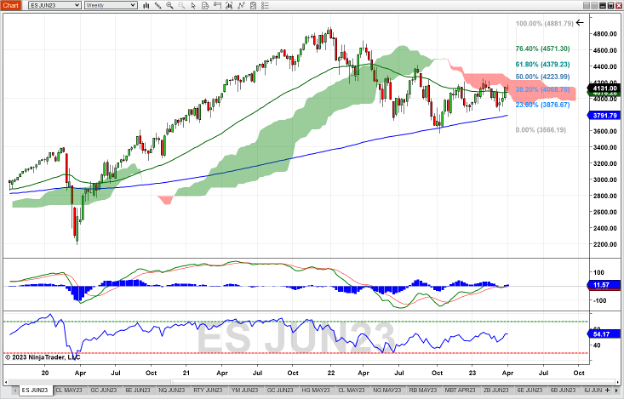
Last week the June E-Mini S&P 500 future gave pause to the current uptrend, as the doji candle (Open = Close) suggests no advancement for buyers nor sellers. It did remain above the 52-week moving average and inside the Ichimoku cloud, which can be considered bullish. Price also remained above the 38.2% Fibonacci retracement level (measured from January to October 2022). While the Relative Strength Index (RSI) is slightly above neutral at 54, the MACD shows a more positive view with a cross above the zero line, and the histogram increasing its positivity. Should the trend continue, look for resistance in the 4220 – 4225 area (50% Fib retracement and the top of the Ichimoku cloud). Support might be found at the 52-Week and 200-Week moving averages (~4075 and ~3800).

Crude Oil Future Weekly Chart
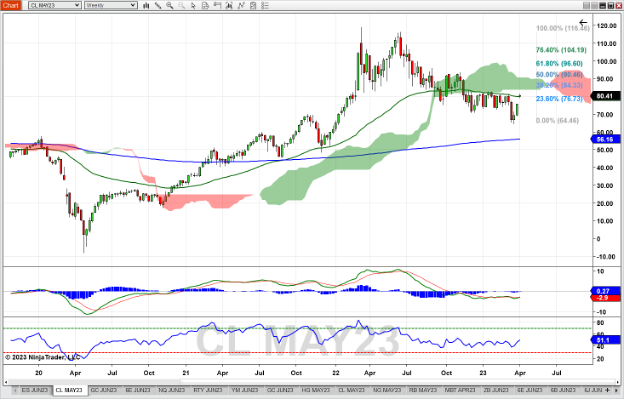
June Crude Oil futures gapped up last week on news of OPEC+ cutting oil production. This propelled oil above the 23.6% Fibonacci retracement level (76.73) and the 52-week moving average (80.03). This also moved the price of oil from the bottom to the top of the recent consolidation range of 70 – 82. RSI continued to increase to 51, and the MACD Histogram turned positive, which can indicate future bullishness. The next obstacles to the bullish case can be found at 83.75 (the bottom of the Ichimoku cloud) and 84.33 (38.2 % Fib retracement). Targets to the downside are suggested by the recent low in March (64.46) and the 200-Week moving average (~56.25).

Gold Future Weekly Chart
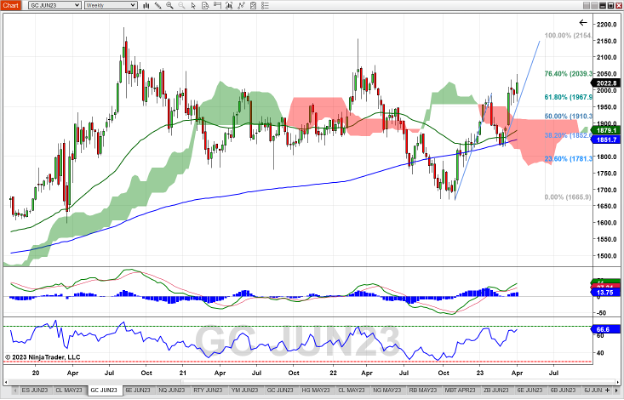
The June Gold future (GC) showed some strength last week as it resumed the recent uptrend that began in early March. Trading above the 52-week and 200-week moving averages, as well as the top of the Ichimoku cloud, its no surprise that the momentum indicators are at positive levels. The MACD and its histogram have been bullish since mid-October, and the RSI at 66 is nearing overbought levels. Watch out for divergence should the RSI pause and reverse, as the RSI is unable to take out the previous RSI peak. Should the bullish trend continue, resistance at 1040 (76.4 % Fib retracement level) will occur before the target of 2150, which is near highs from March 2022, and the level indicated by applying the previous bullish trend distance to the most recent swing low in October 2022. Support could be found at 61.8% Fib retracement level (19686) and the top of the Ichimoku cloud (1910).

Euro FX Future Weekly Chart
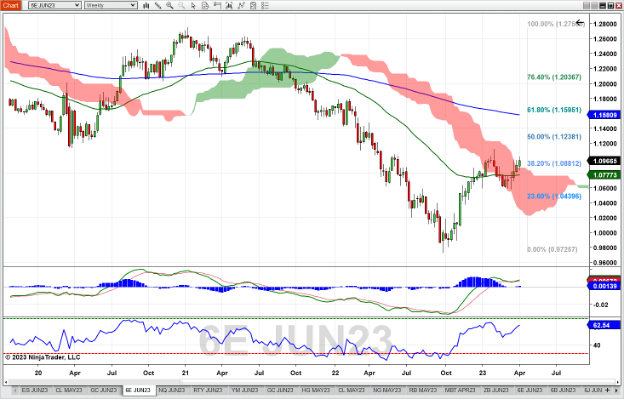
Euro FX futures (6E) continued the rally off recent lows at the 1.06 level. This marks the 6th consecutive week that Euro FX has finished with a bullish candle, and the first candle wherein the body is entirely above the Ichimoku cloud. It also crossed and closed above the 38.2% Fibonacci retracement level. The RSI continues to rise (to 62) nearing the overbought level of 70. The MACD and its histogram stays positive, which is bullish. Targets to the upside include the 50% retracement level (1.1238) and the 200-week moving average (~1.1580). A reversal to the downside could experience support at the top of the Ichimoku cloud (1.0867) and the 52-week moving average (~1.0770).

Economic Reports for the week of April 10th–April 14th
At first glance this week looks a little light on economic activity, some big reports are slated for mid-week. Consumer Price Index (CPI) on Tuesday and Producer Price Index (PPI) on Wednesday will give insight into inflation, and by extension whether the Fed has a handle on inflation (or not). Also at noon on Tuesday, the monthly World Agricultural Supply and Demand Estimates (WASDE) report arrives to inform the cotton, corn, soybean and wheat markets. Weekly Oil Stock numbers from API and EIA drop Tuesday afternoon and Wednesday morning – which are more interesting after last week’s advance on OPEC+’s announced cuts in production. Friday is busier than usual as no less than five reports drop between 8:30 and 10 AM ET. Federal Reserve Bank Presidents Austan Goolsbee (Chicago) and Thomas Barkin (Richmond) speak on Tuesday and Wednesday, respectively. Barkin’s speaking engagement occurs after CPI reports, so look for possible market reaction if he speaks specifically how the Fed might react to the CPI data.
***Market Moving Indicators
*Merit Extra Attention
| Date | Economic Reports |
|---|---|
| Monday, April 10th | 10:00 AM ET: Wholesale Inventories (Preliminary) 11:00 AM ET: Export Inspections 4:00 PM ET: Crop Progress |
| Tuesday, April 11th | 6:00 AM ET: NFIB Small Business Optimism Index 12:00 PM ET: Crop Production 12:00 PM ET: USDA Supply/Demand - Cotton, Corn, Soybean, Wheat* 1:30 PM ET: Chicago Federal Reserve Bank President Austan Goolsbee Speech 4:30 PM ET: API Weekly Oil Stocks* |
| Wednesday, April 12th | 7:00 AM ET: MBA Mortgage Applications 8:00 AM ET: Bank Reserve Settlement 8:30 AM ET: CPI*** 9:10 AM ET: Richmond Federal Reserve Bank President Thomas Barkin Speech 10:00 AM ET: Atlanta Fed Business Inflation Expectations 10:30 AM ET: EIA Petroleum Status Report* 11:30 AM ET: 4-Month Bill Auction 1:00 PM ET: 10-Yr Note Auction 2:00 PM ET: FOMC Minutes |
| Thursday, April 13th | 8:30 AM ET: Export Sales 8:30 AM ET: Jobless Claims 8:30 AM ET: PPI-Final Demand*** 10:30 AM ET: EIA Natural Gas Report 4:30 PM ET: Fed Balance Sheet |
| Friday, April 14th | 8:30 AM ET: Import and Export Prices* 8:30 AM ET: Retail Sales* 9:15 AM ET: Industrial Production 10:00 AM ET: Business Inventories 10:00 AM ET: Consumer Sentiment 1:00 PM ET: Baker Hughes Rig Count |
Be sure to check back weekly and follow us on our social media accounts to receive alerts of our Futures Outlooks week to week.
Get Started with NinjaTrader
NinjaTrader supports more than 800,000 traders worldwide with a powerful and user-friendly trading platform, discount futures brokerage and world-class support. NinjaTrader is always free to use for advanced charting and strategy backtesting through an immersive trading simulator.Download NinjaTrader’s award-winning trading platform and get started with a free trading demo with real-time market data today!

