In this week’s coverage, we analyze the rally in E-mini S&P 500 futures, and the bearish trends in natural gas, British pound and gold futures. We also examine the economic and earnings reports expected next week.
Commentary and charts reflect data at the time of writing. Market conditions are subject to change and may not reflect all market activity.
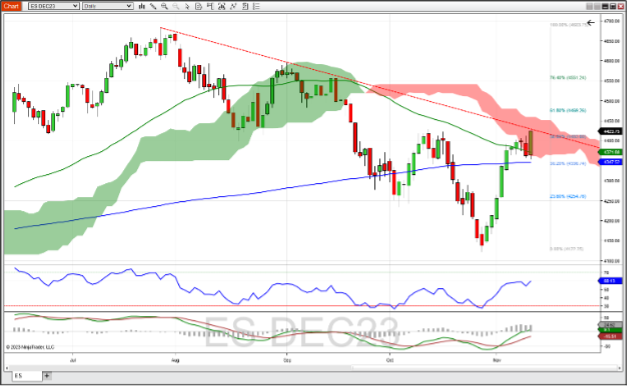
December E-Mini S&P 500 Index Futures Daily Chart
December E-mini S&P 500 Index futures finished the weak strong despite a stutter that occurred due to the weak participation in the 30-year bond auction on Thursday. Friday’s recovery pushed the E-mini S&Ps above the 50-day moving average, only to find resistance at the trendline found by connecting highs from July 27 and September 1. At 60+, RSI is mirroring price movement and is not yet overbought. MACD is bullish, having just crossed above 0 on Friday with a complementary histogram also positive. Should the uptrend continue, expect resistance at the 61.8 % Fib retracement level (4,469.25). A reverse to the downside might see support at the bottom of the Ichimoku cloud (~4,355).

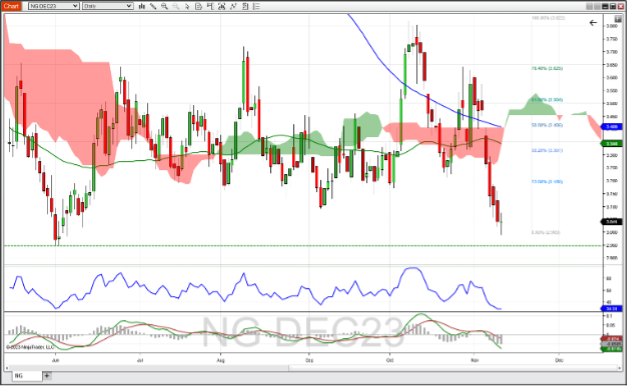
December Natural Gas Futures Daily Chart
December natural gas oil futures declined every day last week except Friday, after beginning with a gap down to cross below the 200-day moving average. That same candle finished below the 50-day moving average and below the bottom of the Ichimoku cloud-both are bearish events. Despite the big move down, RSI finished failed to reach the oversold level of 30, stopping short at 34+. MACD is also bearish with both the MACD line and the MACD histogram in negative territory and trending down. If the current trend continues, look for possible support at the previous peak low from June 1 (2.948). If the trend reverses, a stubborn level might be the 23.6% Fibonacci retracement of the that started October 9 (3.186), with another resistance level at the 38.2 % Fib level (3.307).

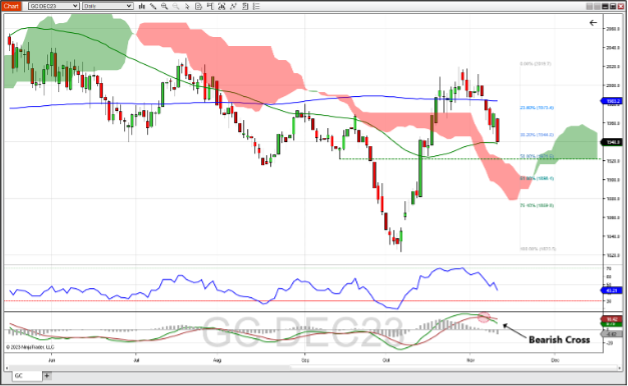
December Gold Futures Daily Chart
December gold futures continued the down trend that began October 30, closing below the 38.2% Fibonacci retracement level and just above the 50-day moving average. The RSI is in a bearish trend, and at 43 has room to go to get to the oversold level of 30. The MACD gave a bearish signal at the same bar where price broke below the 200-day moving average. Should this bearish trend continue, look for possible support at low points from September 14 and October 16, which happens to be the 50% Fibonacci retracement of the uptrend that began October 6 and finished on October 27 (1921.6). A rally could experience headwinds at the 23.6% Fib retracement (1,973.4).

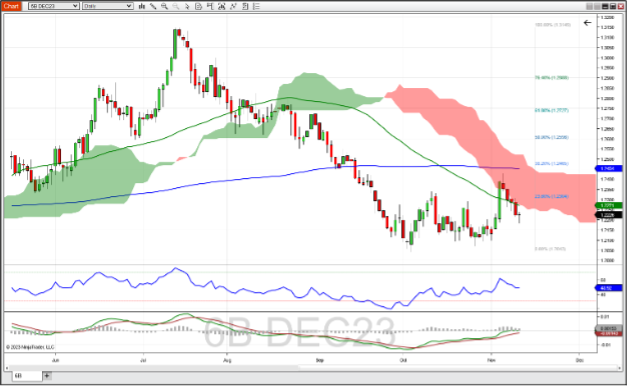
December British Pound Futures Daily Chart
December British pound futures experienced a sell off every day last week, though buyers refused to let the bearish trend finish down on Friday. The Ichimoku cloud acted as resistance the entire week and the 50-day moving average failed to hold as support. The RSI, with a neutral value of about 49, traded in line with price. The MACD was indecisive as both the MACD line and its histogram are trading around 0. If this market continues in a bearish direction, look for support at the October 4 low (1.2043). A rally could experience resistance where the 50-day moving average and the bottom of the Ichimoku cloud meet (~1.2270). Another area of resistance is further up at the 200-day moving average which is near the 38.2 Fibonacci retracement level (~1.2300).

Companies Reporting Earnings November 13 – November 17
Retail companies and small caps take the spotlight this week. Companies included in the Dow Jones Index reporting this week include Home Depot on Tuesday morning and Walmart on Thursday morning.
Other retail companies reporting include Target, JD.com, and Advance Auto Parts on Wednesday morning; Alibaba and Macy's on Thursday morning; and BJ's Wholesale Club on Friday morning.
Tech companies Cisco Systems and Applied Materials report Wednesday afternoon and Thursday afternoon, respectively. Though this week is relatively light with just over 400 companies reporting, important information about the retail picture going into 2024 could be revealed by Walmart, Target and AliBaba.
| Date | Companies Earnings |
|---|---|
| Monday, November 13 | Tyson Foods Inc. (TSN): $0.33 EPS Estimate, $13.73B Revenue Estimate (BMO) |
| Tuesday, November 14 | Home Depot, Inc. (HD): $3.80 EPS Estimate, $25.30B Revenue Estimate (BMO) * |
| Wednesday, November 15 | Target Corp. (TGT): $1.47 EPS Estimate, $10.04B Revenue Estimate (BMO) JD.com, Inc. (JD): $0.79 EPS Estimate, $34.15B Revenue Estimate (BMO) Advance Auto Parts Inc. (AAP): $1.42 EPS Estimate, $2.68B Revenue Estimate (BMO) Cisco Systems, Inc. (CSCO): $0.97 EPS Estimate, $13.79B Revenue Estimate (AMC) |
| Thursday, November 16 | Alibaba Group Holding Ltd. (BABA): $2.12 EPS Estimate, $30.79B Revenue Estimate (BMO) Walmart, Inc. (WMT): $1.51 EPS Estimate, $149.82B Revenue Estimate (BMO) * Macy’s, Inc. (M): $0.00 EPS Estimate, $4.78B Revenue Estimate (BMO) Applied Materials, Inc. (AMAT): $1.98 EPS Estimate, $6.14B Revenue Estimate (AMC) |
| Friday, November 17 | BJ’s Wholesale Club, Inc. (BJ): $0.95 EPS Estimate, $4.90B Revenue Estimate (BMO) |
* indicates that this company is in the Dow Jones Index
Economic Reports for the week of November 13 – November 17
Federal Reserve bank presidents continue their speaking tour this week with Loretta Mester and Austan Goolsbee speaking on Tuesday, Mester John Williams on Thursday, and Goolsbee and Mary Daly on Friday.
They may have more to say as the ever: important Consumer Price Index (CPI) and Producer Price Index (PPI) reports arrive Tuesday and Wednesday mornings. The manufacturing sector is represented by reports from the Kansas City Fed, Philadelphia Fed and New York Fed.
While the EIA failed to produce the Petroleum and Natural Gas reports last week due to a system upgrade, they plan on resuming the reports as scheduled this week. Be aware that additional Fed speaker appearances might occur at any time and could influence the markets.
| Date | Economic Reports |
|---|---|
| Monday, November 13 | 11:00 AM ET: Export Inspections 4:00 PM ET: Crop Progress |
| Tuesday, November 14 | 6:00 AM ET: NFIB Small Business Optimism Index 8:30 AM ET: CPI *** 11:00 AM ET: Cleveland Federal Reserve Bank President Loretta Mester Speech 12:45 PM ET: Chicago Federal Reserve Bank President Austan Goolsbee Speech 4:30 PM ET: API Weekly Oil Stocks |
| Wednesday, November 15 | 7:00 AM ET: MBA Mortgage Applications 8:30 AM ET: Empire State Manufacturing Index 8:30 AM ET: Retail Sales 8:30 AM ET: PPI-Final Demand *** 10:00 AM ET: Wholesale Inventories (Preliminary) 10:00 AM ET: Business Inventories 10:00 AM ET: Atlanta Fed Business Inflation Expectations 10:30 AM ET: EIA Petroleum Status Report * |
| Thursday, November 16 | 8:30 AM ET: Export Sales 8:30 AM ET: Jobless Claims *** 8:30 AM ET: Philadelphia Fed Manufacturing Index 8:30 AM ET: Import and Export Prices 8:30 AM ET: Cleveland Federal Reserve Bank President Loretta Mester Speech 9:15 AM ET: Industrial Production 9:25 AM ET: New York Federal Reserve Bank President John Williams Speech 10:00 AM ET: Housing Market Index 10:30 AM ET: EIA Natural Gas Report * 11:00 AM ET: Kansas City Fed Manufacturing Index 12:00 PM ET: Cleveland Federal Reserve Bank President Loretta Mester Speech 4:00 PM ET: Treasury International Capital 4:30 PM ET: Fed Balance Sheet |
| Friday, November 17 | 8:30 AM ET: Housing Starts and Permits * 9:45 AM ET: Chicago Federal Reserve Bank President Austan Goolsbee Speech 10:00 AM ET: Quarterly Services Survey 10:00 AM ET: E-Commerce Retail Sales 10:00 AM ET: San Francisco Federal Reserve Bank President Mary Daly Speech 1:00 PM ET: Baker Hughes Rig Count 3:00 PM ET: Cattle On Feed |
*** Market Moving Indicators
* Merit Extra Attention
Ready For More?
Learn the basics of technical analysis with our free multi-video trading course, “Technical Analysis Made Easy.”
Join our daily livestream events as we prepare, analyze and trade the futures markets in real time.
Start Trading Futures With NinjaTrader
NinjaTrader supports more than 800,000 futures traders worldwide with our award-winning trading platforms, world-class support and futures brokerage services with $50 day trading margins. The NinjaTrader desktop platform is always free to use for advanced charting, strategy backtesting, technical analysis and trade simulation.
Get to know our:
- Futures brokerage: Open an account size of your choice—no deposit minimum required—and get free access to our desktop, web and mobile trading platforms.
- Free trading simulator: Sharpen your futures trading skills and test your ideas risk-free in our simulated trading environment with 14 days of livestreaming futures market data.
Better futures start now. Open your free account to access NinjaTrader’s award-winning trading platforms, plus premium training and exclusive daily market commentary.

