In this week’s coverage, we analyze the bearish trend in E-mini S&P 500 futures, the pullback in crude oil futures, the bounce in silver futures and the strong bull trend in the Dollar Index futures. We also examine the economic and earnings reports expected next week.
Commentary and charts reflect data at the time of writing. Market conditions are subject to change and may not reflect all market activity.
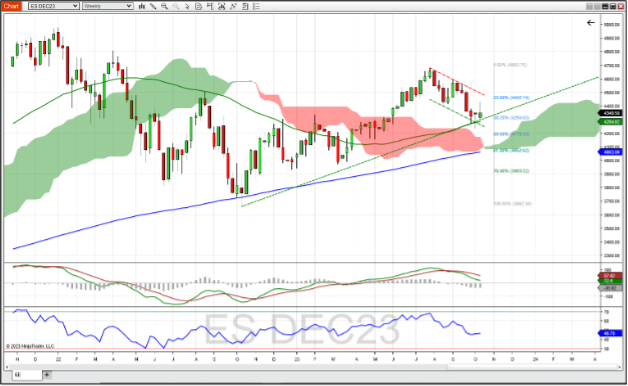
December E-Mini S&P 500 Index Futures Weekly Chart
December E-mini S&P 500 Index futures, despite having a positive week last week, finished near the bottom of a trend channel that began in early August. Last week’s low tested the bullish support line that connected lows from October 2022 and March 2023. This coincided with the 38% Fibonacci retracement level as determined by the uptrend that started in October 2022 and finished at the beginning of July of this year. The 52-week moving average also acted as support last week, which is a bullish indication. The RSI at 47 reflects price activity, though the MACD histogram is negative, it shows early signs of bottoming and turning around towards positive levels. Should this rebound continue resistance might be found at the 23.6% Fib retracement level (~4,442). If the bearish trend continues, this market may find support at the 50% Feb retracement level (~4,175).

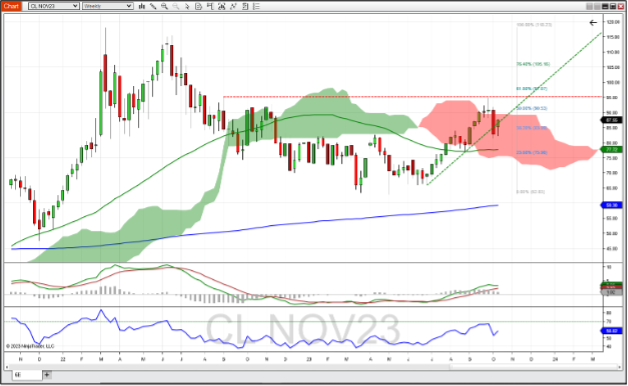
November Crude Oil Futures Weekly Chart
November crude oil futures gapped up to start the week after recent geopolitical events, and finished the week at the high. This put crude back on the bullish side of a support line found by connecting Lowe's from mid-July and late August. This also reversed crude oil’s downward trend into the Ichimoku cloud, with a potential break above the top of the cloud in reach for next week. RSI ticked up in line with price, and the MACD and its histogram are both positive. If this bullish reversal continues expect resistance at the top of the Ichimoku cloud and at the 50% Fibonacci retracement level found from the trend started in June 2022 and finishing in May 2023 (~90.50). A bearish reversal might find support at the 52-week moving average (~77.75).

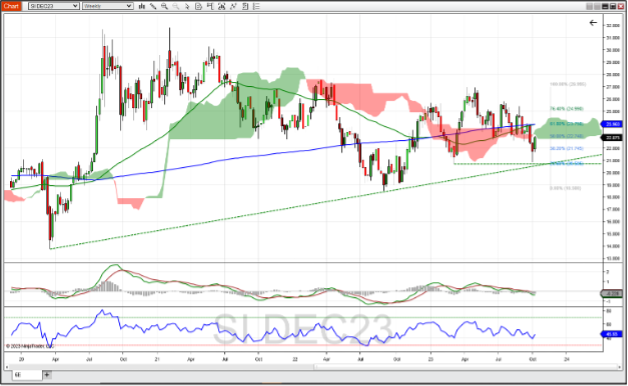
December Silver Futures Weekly Chart
December silver futures finish the week positive, closing above the 50% Fibonacci retracement level of the upward trend from August 2022 to April 2023. The high of the candle got close to the bottom of the Ichimoku cloud, which held as resistance. Also last week the 52-week moving average crossed above the 200-week moving average, indicating a bullish longer-term trend. The RSI at 45 had turned up with price, and the MACD histogram turned up toward 0, indicating a possible bullish trend is near. Possible resistance areas are the bottom of the Ichimoku cloud (~23.125) and the 61.8% Fibonacci retracement level (~23.75). Support might be found at the 38.2% Fibonacci retracement level (~21.75) and further on down towards the March lows (~20.70).

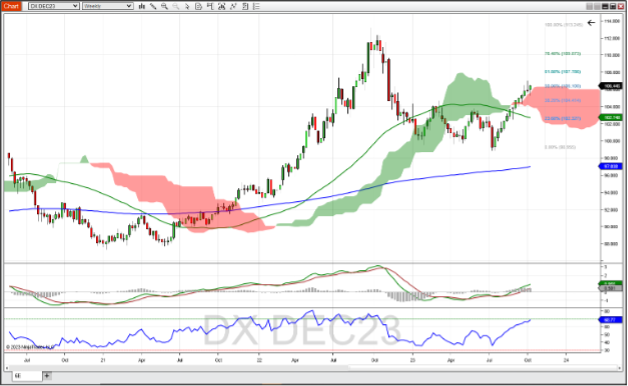
December Dollar Index Futures Daily Chart
December Dollar Index futures continue to find support at the top of the Ichimoku cloud, with last week's close occurring above the 50% Fibonacci retracement level of the trend that started in September 2022 and ended in July this year. Last week's candle represents the 12th of 13 bullish candles in a row as prices trading above the 52-week and the 200-week moving average. The MACD and its histogram are both positive (bullish) and with RSI is nearing the overbought level of 70 (also bullish). Resistance might be found at the 61.8% Fibonacci level (~107.80), while support might be found at the 38.2% Fibonacci retracement level which coincides with the high from March of this year (104.50).

Companies Reporting Earnings October 16 – October 20
Earnings season is in full swing as financial companies are heavily represented throughout the week, starting with Charles Schwab reporting before market open on Monday. Bank of America and Bank of New York report Tuesday morning; Morgan Stanley, U.S. Bancorp, and State Street report on Wednesday morning; and Discover Financial Services reports on Wednesday afternoon.
Dow Jones Futures could see volatility with five companies reporting (Goldman Sachs and Johnson & Johnson on Tuesday morning, Procter & Gamble and Traveler’s on Thursday morning, and American Express on Friday morning). Communications mainstay Ericsson arrives on Tuesday, and AT&T and Nokia report on Thursday morning as well. NASDAQ and S&P 500 futures may see some volatility after markets on Wednesday, when both Tesla and Netflix report their earnings.
Other notable companies are American Airlines and United Airlines on Tuesday (representing the Travel & Entertainment sector), Lockheed Martin on Tuesday (Defense sector) and Elevance Health on Wednesday (Healthcare).
| Date | Companies Earnings |
|---|---|
| Monday, October 16 | Charles Schwab Corp. (SCHW): $0.75 EPS Estimate, $4.68B Revenue Estimate (BMO) |
| Tuesday, October 17 | Bank of America Corp. (BAC): $0.80 EPS Estimate, $25.21B Revenue Estimate (BMO) Lockheed Martin Corp. (LMT): $6.66 EPS Estimate, $16.70B Revenue Estimate (BMO) Goldman Sachs Group, Inc. (GS): $5.32 EPS Estimate, $11.07B Revenue Estimate (BMO) * Johnson & Johnson (JNJ): $2.52 EPS Estimate, $21.04B Revenue Estimate (BMO) * Bank of New York (BK): $1.14 EPS Estimate, $4.35B Revenue Estimate (BMO) Ericsson (ERIC): $0.07 EPS Estimate, $6.27B Revenue Estimate (BMO) Albertsons Companies, Inc. (ACI): $0.54 EPS Estimate, $18.28B Revenue Estimate (BMO) United Airlines (UAL): $3.40 EPS Estimate, $14.43B Revenue Estimate (AMC) J.B. Hunt Transport Services, Inc. (JBHT): $1.89 EPS Estimate, $3.19B Revenue Estimate (AMC) |
| Wednesday, October 18 | Procter & Gamble Corp. (PG): $1.71 EPS Estimate, $21.56B Revenue Estimate (BMO) * Morgan Stanley (MS): $1.27 EPS Estimate, $13.35B Revenue Estimate (BMO) Abbott (ABT): $1.10 EPS Estimate, $9.81B Revenue Estimate (BMO) U.S. Bancorp (USB): $1.04 EPS Estimate, $7.04B Revenue Estimate (BMO) Elevance Health (ELV): $8.45 EPS Estimate, $42.60B Revenue Estimate (BMO) Traveler’s Companies, Inc. (TRV): $2.93 EPS Estimate, $10.32B Revenue Estimate (BMO) * State Street Corp. (STT): $1.78 EPS Estimate, $2.94B Revenue Estimate (BMO) Tesla, Inc. (TSLA): $0.75 EPS Estimate, $24.26B Revenue Estimate (AMC) Netflix, Inc. (NFLX): $3.47 EPS Estimate, $8.43B Revenue Estimate (AMC) Discover Financial Services (DFS): $3.15 EPS Estimate, $3.94B Revenue Estimate (AMC) |
| Thursday, October 19 | AT&T Corp. (T): $0.62 EPS Estimate, $30.21B Revenue Estimate (BMO) American Airlines Group Inc. (AAL): $0.33 EPS Estimate, $13.51B Revenue Estimate (BMO) Nokia Corp. (NOK): $0.09 EPS Estimate, $6.20B Revenue Estimate (BMO) Philip Morris International Inc (PM): $1.61 EPS Estimate, $9.19B Revenue Estimate (BMO) |
| Friday, October 20 | American Express Co. (AXP): $2.96 EPS Estimate, $15.41B Revenue Estimate (BMO) * |
* indicates that this company is in the Dow Jones Index
Economic Reports for the week of October 16 – October 20
The Federal Reserve Bank president speaking tour goes into overdrive next week as six presidents are scheduled to speak this week. John Williams of New York and Patrick Harker have much to say with two and five appearances scheduled, respectively. Note that there may be more Federal Reserve speaking engagements/events as the week unfolds.
The housing market is represented with the Housing Market Index on Tuesday morning, Mortgage Applications and Housing Starts and Permits on Wednesday morning, and Existing Home Sales on Thursday morning. The EIA Petroleum report on Wednesday and the Baker Hughes Rig Count of Friday afternoon may show reaction to events in the Middle East, which in turn may affect the crude oil market.
| Date | Economic Reports |
|---|---|
| Monday, October 16 | 8:30 AM ET: Empire State Manufacturing Index 10:30 AM ET: Philadelphia Federal Reserve Bank President Patrick Harker Speech 11:00 AM ET: Export Inspections 4:00 PM ET: Crop Progress 4:30 PM ET: Philadelphia Federal Reserve Bank President Patrick Harker Speech |
| Tuesday, October 17 | 8:00 AM ET: New York Federal Reserve Bank President John Williams Speech 8:30 AM ET: Retail Sales 9:15 AM ET: Industrial Production 10:00 AM ET: Business Inventories 10:00 AM ET: Housing Market Index * 10:45 AM ET: Richmond Federal Reserve Bank President Thomas Barkin Speech 4:30 PM ET: API Weekly Oil Stocks |
| Wednesday, October 18 | 7:00 AM ET: MBA Mortgage Applications 8:30 AM ET: Housing Starts and Permits 10:30 AM ET: EIA Petroleum Status Report * 12:30 PM ET: New York Federal Reserve Bank President John Williams Speech 2:00 PM ET: Beige Book 3:15 PM ET: Philadelphia Federal Reserve Bank President Patrick Harker Speech 4:00 PM ET: Treasury International Capital |
| Thursday, October 19 | 8:30 AM ET: Export Sales 8:30 AM ET: Philadelphia Fed Manufacturing Index 8:30 AM ET: Jobless Claims *** 10:00 AM ET: Leading Indicators 10:00 AM ET: Existing Home Sales 10:30 AM ET: EIA Natural Gas Report * 1:20 PM ET: Chicago Federal Reserve Bank President Austan Goolsbee Speech 4:00 PM ET: Atlanta Federal Reserve Bank President Raphael Bostic Speech 4:30 PM ET: Fed Balance Sheet 5:30 PM ET: Philadelphia Federal Reserve Bank President Patrick Harker Speech |
| Friday, October 20 | 9:00 AM ET: Philadelphia Federal Reserve Bank President Patrick Harker Speech 12:15 PM ET: Cleveland Federal Reserve Bank President Loretta Mester Speech 1:00 PM ET: Baker Hughes Rig Count 3:00 PM ET: Cattle on Feed |
*** Market Moving Indicators
* Merit Extra Attention
Ready For More?
Learn the basics of technical analysis with our free multi-video trading course, “Technical Analysis Made Easy.”
Join our daily livestream events as we prepare, analyze and trade the futures markets in real time.
Start Trading Futures With NinjaTrader
NinjaTrader supports more than 800,000 futures traders worldwide with our award-winning trading platforms, world-class support and futures brokerage services with $50 day trading margins. The NinjaTrader desktop platform is always free to use for advanced charting, strategy backtesting, technical analysis and trade simulation.
Get to know our:
- Futures brokerage: Open an account size of your choice—no deposit minimum required—and get free access to our desktop, web and mobile trading platforms.
- Free trading simulator: Sharpen your futures trading skills and test your ideas risk-free in our simulated trading environment with 14 days of livestreaming futures market data.
Better futures start now. Open your free account to access NinjaTrader’s award-winning trading platforms, plus premium training and exclusive daily market commentary.

