In this week’s coverage, we analyze the bullish trend in the Micro Nasdaq 100 Index and RBOB gasoline futures, the rally in Micro Bitcoin futures, and the consolidating trend in the 10-year note futures. We also examine the economic reports and earnings announcements expected next week.
Commentary and charts reflect data at the time of writing. Market conditions are subject to change and may not reflect all market activity.
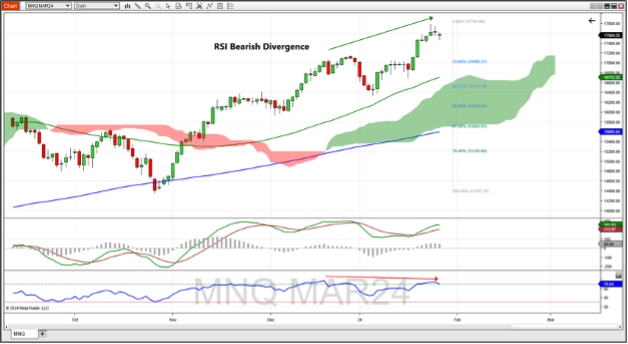
March Micro Nasdaq 100 Index Futures Daily Chart
March Micro Nasdaq 100 Index futures finished up on the week, experiencing a slight pullback Friday. Nasdaq remains bullish, remaining well above the 50-day moving average, the 200-day moving average and the top of the Ichimoku cloud. While MACD and its histogram are positive, the histogram turned down, which could be the beginning of weakness in momentum. The RSI crossed below the overbought level of 70, showing signs of bearish divergence, wherein Nasdaq peak prices are increasing while RSI high peaks are decreasing. Should Nasdaq continue the bullish trend, resistance might be found at the recent high of about 17,800. If price breaks down, support might be found at the 23.6% Fibonacci retracement level (~16,980) and further down at the 50-day moving average (~16,710).

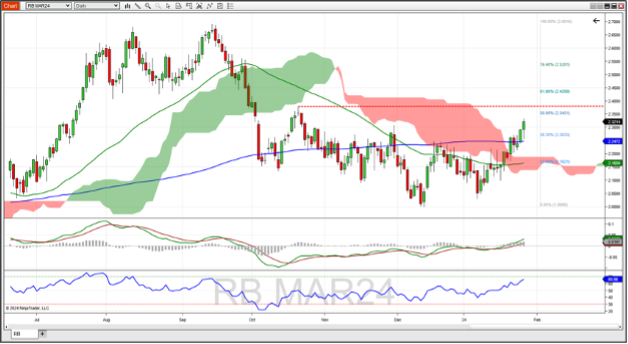
March RBOB Gasoline Futures Daily Chart
March RBOB gasoline futures continued the bullish trend that began January 8. While gasoline crossed above the 200-day moving average Monday, it struggled to stay above, but finished the week with a decisive breakout above the 200-day MA. Last week's action also kept gasoline above the Ichimoku cloud and the 50-day moving average. The MACD crossed above the zero-line early in the week, and the RSI trended with price, getting closer to that overbought level of 70. Should the uptrend continue, resistance might be found at the 50% Fibonacci retracement level (2.3451) and further at the previous high from October (~2.38). A retracement might find support at the 200-day moving average (~2.2475) and further down at the top of the Ichimoku cloud (~2.1875).

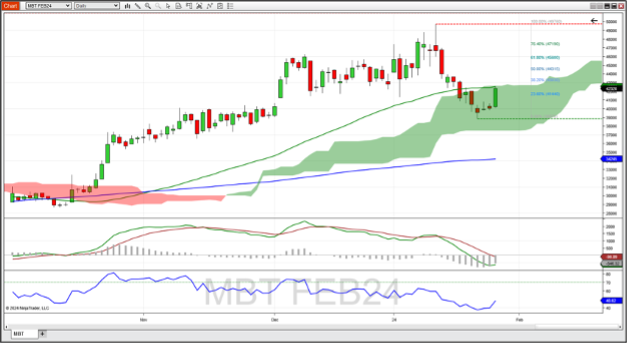
February Bitcoin Futures Daily Chart
February Bitcoin futures finished the week in the positive as Friday's rally tested the 50-day moving average and the top of the Ichimoku cloud. This also put Bitcoin above the 23.6% Fibonacci retracement level. With Friday’s strong finish, the MACD histogram accelerated toward the zero-line, setting it up for a potential bullish cross soon. RSI turned up with price as well. Should this rally continue, resistance might be found at the 38.2% Fibonacci level (43,030) and beyond that the 50% Fibonacci level (44,315). A pullback to the downside could see support at the recent lowest low of 38,870.

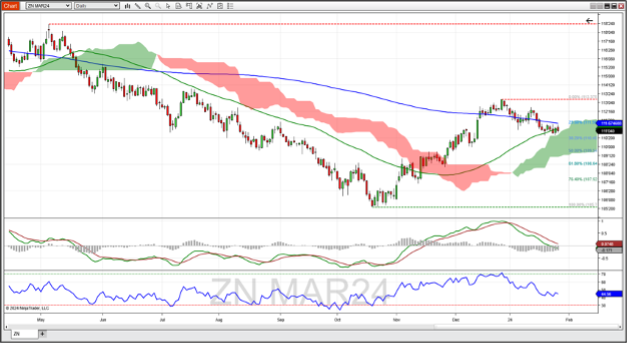
March 10-Year Note Futures Daily Chart
March 10-year note futures remained roughly unchanged last week as the 50-day moving average is still holding as support, as is the top of the Ichimoku cloud. 10-year notes just could not trade up to the 200-day moving average, resulting in sideways trading last week. The MACD has been in a decline since late December, finally crossing below the zero-line last week. The RSI is trading in line with price. Should this market rally and break out above the 50-day moving average, resistance might be found at the recent peak high (113’12). A breakdown below the 50-day MA would mean support might be found at the top of the Ichimoku cloud, which coincides with the 38.2% Fibonacci retracement level of the previous uptrend (110’20). Further support might be found at the bottom of the Ichimoku cloud, which coincides with the 50% to retracement level (109’17).

Companies Reporting Earnings January 29 – February 2
Five of the Magnificent Seven stocks report earnings this week (Microsoft and Google after markets Tuesday and Amazon, Apple and Meta on Thursday afternoon), so look for increased volatility in Nasdaq and S&P futures on those afternoons, and at the regular trading hours open the following morning.
Five Dow Jones companies report earnings Tuesday through Friday. Boeing will be one to watch Wednesday morning, as the extent to which their recent miscues have affected earnings and revenue will be known. Oil companies share the spotlight with tech as Chevron, ExxonMobil, Marathon Petroleum, Hess Corp and Phillips 66 all report; these earnings calls could influence energy futures in addition to the stock index futures.
Insurance companies AFLAC, MetLife and CIGNA Corp. report this week, and companies from the health care sector that are reporting include Pfizer, AbbVie and Bristol-Myers Squibb.
| Date | Companies Earnings |
|---|---|
| Monday, January 29 | Whirlpool Corp. (WHR): $3.64 EPS Estimate, $4.98B Revenue Estimate (AMC) |
| Tuesday, January 30 | Pfizer, Inc. (PFE): $-0.19 EPS Estimate, $14.28B Revenue Estimate (BMO) General Motors Corp. (GM): $1.08 EPS Estimate, $38.75B Revenue Estimate (BMO) United Parcel Service, Inc. (UPS): $2.44 EPS Estimate, $25.48B Revenue Estimate (BMO) JetBlue Airways Corporation (JBLU): $-0.28 EPS Estimate, $2.27B Revenue Estimate (BMO) Marathon Petroleum Corp. (MPC): $2.36 EPS Estimate, $34.90B Revenue Estimate (BMO) Advanced Micro Devices, Inc. (AMD): $0.77 EPS Estimate, $6.12B Revenue Estimate (AMC) Microsoft Corp. (MSFT): $2.76 EPS Estimate, $61.03B Revenue Estimate (AMC) * Alphabet Inc. (GOOGL): $1.60 EPS Estimate, $85.26B Revenue Estimate (AMC) Starbucks Corp. (SBUX): $0.93 EPS Estimate, $9.65B Revenue Estimate (AMC) |
| Wednesday, January 31 | Boeing Co. (BA): $-0.72 EPS Estimate, $21.14B Revenue Estimate (BMO) * Mastercard Inc (MA): $6.30 EPS Estimate, $6.48B Revenue Estimate (BMO) Phillips 66 (PSX): $2.37 EPS Estimate, $36.29B Revenue Estimate (BMO) Hess Corp (HES): $1.43 EPS Estimate, $2.84B Revenue Estimate (BMO) QUALCOMM Incorporated (QCOM): $2.37 EPS Estimate, $9.51B Revenue Estimate (AMC) AFLAC, Inc. (TSLA): $1.47 EPS Estimate, $4.40B Revenue Estimate (AMC) MetLife Inc. (MET): $1.95 EPS Estimate, $18.46B Revenue Estimate (AMC) |
| Thursday, February 1 | Merck & Co., Inc. (MRK): $-0.09 EPS Estimate, $14.51B Revenue Estimate (BMO) * Honeywell International, Inc. (HON): $2.60 EPS Estimate, $9.69B Revenue Estimate (BMO) * Amazon.com Inc. (AMZN): $0.81 EPS Estimate, $166.04B Revenue Estimate (AMC) Apple, Inc. (AAPL): $2.09 EPS Estimate, $118.00B Revenue Estimate (AMC) * Meta Platforms, Inc. (META): $4.81 EPS Estimate, $38.82B Revenue Estimate (AMC) United States Steel Corp. (META): $0.29 EPS Estimate, $3.76B Revenue Estimate (AMC) |
| Friday, February 2 | Exxon Mobil Corp. (XOM): $2.22 EPS Estimate, $91.81B Revenue Estimate (BMO) Chevron Corporation (CVX): $3.29 EPS Estimate, $51.33B Revenue Estimate (BMO) * AbbVie Inc. (ABBV): $2.77 EPS Estimate, $14.00B Revenue Estimate (BMO) Bristol-Myers Squibb Co. (CVX): $1.65 EPS Estimate, $11.21B Revenue Estimate (BMO) CIGNA Corp. (CI): $6.52 EPS Estimate, $48.85B Revenue Estimate (BMO) |
* indicates that this company is in the Dow Jones Index
Economic Reports for the week of January 29 – February 2
FOMC announcement week start quietly, with the Dallas Fed Manufacturing Survey acting as the lone economic report Monday. Tuesday is a bit busier, as two reports on the housing market are released at 9 AM ET (Case-Shiller Home Price Index and FHFA House Price Index). The Case-Shiller HPI samples from 20 metropolitan areas in the U.S. and is expected to increase to 5.8% (vs. last month’s increase of 4.9%).
The FHFA HPI is a broader area in the U.S. and is expected to decline to 0.2% from the previous month’s 0.3%. Also on Tuesday, Consumer Confidence from the Conference Board and the Job Openings and Labor Turnover Survey (JOLTS) from the Bureau of Labor Statistics could introduce volatility into the markets, as JOLTS is forecast to decline, and Consumer Confidence is expected to rise.
Wednesday’s big event is the FOMC announcement at 2 PM and the subsequent press conference at 2:30. While no change to rates is all but baked into the cake at this point, markets could react to Federal Reserve Chair Jerome Powell’s comments after the announcement. Before the announcement are two labor-related reports: ADP Employment report at 8:15 AM and Employment Cost Index at 8:30 AM.
Thursday follows the labor theme with the Challenger Job Cut report at 7:30 AM and Jobless Claims at 8:30 AM. Friday morning sees the last labor-related report for the week in the Employment Situation, which is forecast to tick up to 3.8%. University of Michigan’s Consumer Sentiment at 10 AM Friday could be a market mover, though it is expected to remain unchanged from last month at 78.8. While no Federal Reserve Bank governors or presidents are slated to speak, be aware that the Fed’s silent period ends on Thursday, which means messaging around the FOMC decision and outlook could appear at any time.
| Date | Economic Reports |
|---|---|
| Monday, January 29 | 10:30 AM ET: Dallas Fed Manufacturing Survey @DallasFed 11:00 AM ET: Export Inspections |
| Tuesday, January 30 | 7:00 AM ET: FOMC Meeting Begins 9:00 AM ET: Case-Shiller Home Price Index 9:00 AM ET: FHFA House Price Index 10:00 AM ET: JOLTS *** 10:00 AM ET: Consumer Confidence * 4:30 PM ET: API Weekly Oil Stocks |
| Wednesday, January 31 | 7:00 AM ET: MBA Mortgage Applications 7:00 AM ET: Bank Reserve Settlement 8:15 AM ET: ADP Employment Report 8:30 AM ET: Treasury Refunding Announcement 8:30 AM ET: Employment Cost Index 9:45 AM ET: Chicago PMI 10:30 AM ET: EIA Petroleum Status Report *** 2:00 PM ET: FOMC Announcement 2:30 PM ET: Fed Chair Press Conference 3:00 PM ET: Farm Prices |
| Thursday, February 1 | 7:30 AM ET: Challenger Job-Cut Report 8:30 AM ET: Jobless Claims *** 8:30 AM ET: Productivity and Costs 8:30 AM ET: Export Sales 9:45 AM ET: PMI Manufacturing Final 10:00 AM ET: ISM Manufacturing Index *** 10:00 AM ET: Construction Spending 10:30 AM ET: EIA Natural Gas Report 3:00 PM ET: Grain Crushings 3:00 PM ET: Fats & Oils 4:30 PM ET: Fed Balance Sheet |
| Friday, February 2 | 7:00 AM ET: Motor Vehicle Sales 8:30 AM ET: Employment Situation *** 10:00 AM ET: Consumer Sentiment *** 10:00 AM ET: Factory Orders 1:00 PM ET: Baker Hughes Rig Count |
*** Market Moving Indicators
* Merit Extra Attention
Ready For More?
Learn the basics of technical analysis with our free multi-video trading course, “Technical Analysis Made Easy.”
Join our daily livestream events as we prepare, analyze and trade the futures markets in real time.
Start Trading Futures With NinjaTrader
NinjaTrader supports over 1 million users worldwide with our award-winning trading platforms, world-class support and futures brokerage services with $50 day trading margins. The NinjaTrader desktop platform is always free to use for advanced charting, strategy backtesting, technical analysis and trade simulation.
Get to know our:
- Futures brokerage: Open an account size of your choice—no deposit minimum required—and get free access to our desktop, web and mobile trading platforms.
- Free trading simulator: Sharpen your futures trading skills and test your ideas risk-free in our simulated trading environment with 14 days of livestreaming futures market data.
Better futures start now. Open your free account to access NinjaTrader’s award-winning trading platforms, plus premium training and exclusive daily market commentary.

