Coverage for the week of September 18 – September 22: In this week’s coverage, we analyze the downtrends in British pound and gold futures, the rally in heating oil futures, and the consolidation in Micro NASDAQ futures. We also examine the economic reports expected next week.
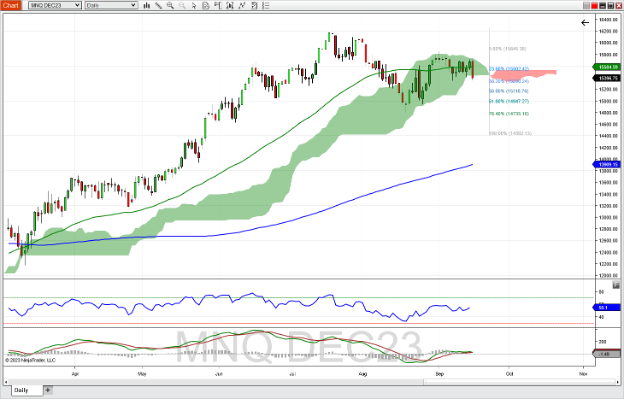
December Micro NASDAQ 100 Index Futures Daily Chart
December Micro NASDAQ 100 Index futures were down for the week, crossing below the bottom of the Ichimoku cloud and failing to stay above the 50-day moving average. RSI is trending in line with price; the MACD and its histogram, though positive, show the possibility of bearish action ahead as the MACD is poised to cross below its signal line. A continuation of this bearish trend that was found on Friday could find support at the 38.2% Fibonacci extension level, which measures the previous down move and applies it from the high at the end of August (~15,290). Further support might be found at the 50% Fibonacci extension level (~15,118). A bullish trend might find resistance at the 50-day moving average (~15,585) and further at the recent high from two weeks ago (~15,856).

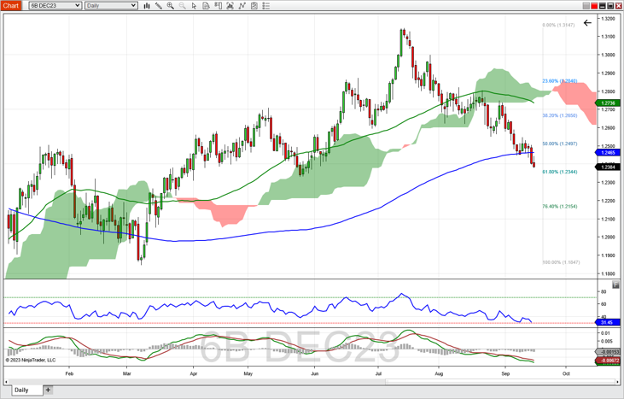
December British Pound Futures Daily Chart
December British pound futures continued their bearish trend, finally breaking below the 200-day moving average, which acted as support for about a week before the break. The RSI is approaching the oversold level of 30 and is trending in line with price. Both the MACD line and MACD histogram are trending negative while below zero, indicating bearish sentiment. Should the bearish trend continue, support could be found at the 61.8% Fibonacci Retracement level of the bullish move from March to July (~1.234). A reversal to the upside could find resistance at the 200-day moving average (~1.2465) and further at the 50% Fib retracement level (~1.2500).

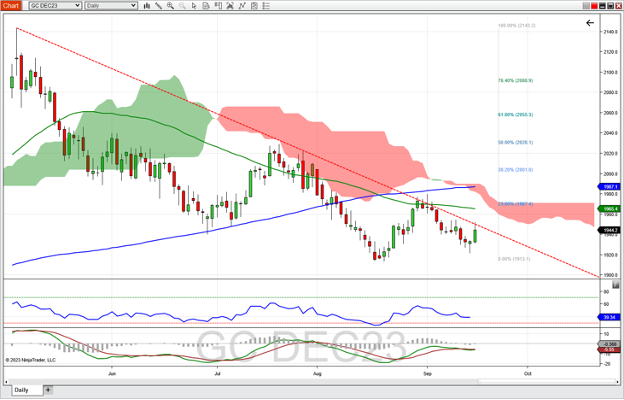
December Gold Futures Daily Chart
December gold futures rallied on Friday to push gold into the plus column for the week. Price has to the resistance line that connects peak highs beginning in May of this year, before backing off. The longer-term trend is still bearish though with price underneath both it's 50- and 200-day moving averages, and the Ichimoku cloud as well. RSI is trending lower with price and the MACDD is negative with no direction shown by the histogram should the trend turn bullish look for resistance at the 50-day moving average and the 23.6% retracement level. Support in a bearish move could be found at recent lows in August (~1,913) and longer-term lows in March of this year (~1,890).

October Heating Oil Futures Daily Chart
October heating oil futures finished last week positively, though Friday's trading gave back 50% of the week's gains. The bullish trend does not show signs of diminishing as price is trading well above its 50- and 200-day moving averages, and the Ichimoku cloud. RSI crossed above the overbought level of 70, and both the MACD line and MACD histogram remained positive. Should Friday's bearish move continue, look for support at the upward sloping trend line, as determined by the lows starting at the beginning of July (~3.30). Further support could be found at the 23.6% Fibonacci retracement level as determined by the uptrend that started in May of this year (~2.95). Possible resistance could occur at the psychological level of 3.500.

Commentary: As the CME’s FedWatch site shows, the current probability of no rate hike at 97%, response to the Fed’s announcement at 2 PM ET Wednesday should be minimal. More telling will be Federal Reserve Chair Jerome Powell’s comments at the 2:30 PM ET press conference, where he may give some clues as to a possible future rate hike, how long rates will stay elevated, and if he believes that the Fed has inflation under control.
This is where various futures markets might see a pickup in volatility. Otherwise, a slower week for economic reports is on tap. Aspects of the housing market are revealed almost every morning, with the Housing Market Index on Monday, Housing Starts and Permits on Tuesday, MBA Mortgages on Wednesday, and Existing Home Sales on Thursday. Manufacturing reports on Thursday (Philly Fed) and Friday (PMI Composite Flash) give insight into the production side of the economy.
Jobless Claims could move markets on Thursday morning as the sole labor-related report this week. While earnings season has not quite started, FedEx reports at market close on Wednesday afternoon, and could be a preview of what’s to come in October’s earnings reports.
Economic Reports for the week of September 18 – September 22
| Date | Economic Reports |
|---|---|
| Monday, September 18 | 10:00 AM ET: Housing Market Index 11:00 AM ET: Export Inspections 4:00 PM ET: Crop Progress 4:00 PM ET: Treasury International Capital |
| Tuesday, September 19 | 8:00 AM ET: FOMC Meeting Begins 8:30 AM ET: Housing Starts and Permits 4:30 PM ET: API Weekly Oil Stocks |
| Wednesday, September 20 | 7:00 AM ET: MBA Mortgage Applications 10:30 AM ET: EIA Petroleum Status Report * 2:00 PM ET: FOMC Announcement * 2:30 PM ET: Fed Chair Press Conference *** 4:00 PM ET: FedEx Earnings ($3.70 Estimated EPS, $21.81B Estimated Revenue) |
| Thursday, September 21 | 8:30 AM ET: Jobless Claims *** 8:30 AM ET: Export Sales 8:30 AM ET: Philadelphia Fed Manufacturing Index 8:30 AM ET: Current Account 10:00 AM ET: Leading Indicators 10:00 AM ET: Existing Home Sales 10:30 AM ET: EIA Natural Gas Report * 4:30 PM ET: Fed Balance Sheet |
| Friday, September 22 | 9:45 AM ET: PMI Composite Flash 1:00 PM ET: Baker Hughes Rig Count 3:00 PM ET: Cattle On Feed |
*** Market Moving Indicators
* Merit Extra Attention
Ready For More?
Learn the basics of technical analysis with our free multi-video trading course, “Technical Analysis Made Easy.”
Join our daily livestream events as we prepare, analyze and trade the futures markets in real time.
Start Trading Futures With NinjaTrader
NinjaTrader supports more than 800,000 futures traders worldwide with our award-winning trading platforms, world-class support and futures brokerage services with $50 day trading margins. The NinjaTrader desktop platform is always free to use for advanced charting, strategy backtesting, technical analysis and trade simulation.
Get to know our:
- Futures brokerage: Open an account size of your choice—no deposit minimum required—and get free access to our desktop, web and mobile trading platforms.
- Free trading simulator: Sharpen your futures trading skills and test your ideas risk-free in our simulated trading environment with 14 days of livestreaming futures market data.
Better futures start now. Open your free account to access NinjaTrader’s award-winning trading platforms, plus premium training and exclusive daily market commentary.

