In this week’s coverage, we analyze the bullish trends in Micro Nasdaq 100 Index and 10-year note futures, and the consolidating activity in Micro Bitcoin and RBOB gasoline futures. We also examine the economic reports expected next week.
Commentary and charts reflect data at the time of writing. Market conditions are subject to change and may not reflect all market activity.
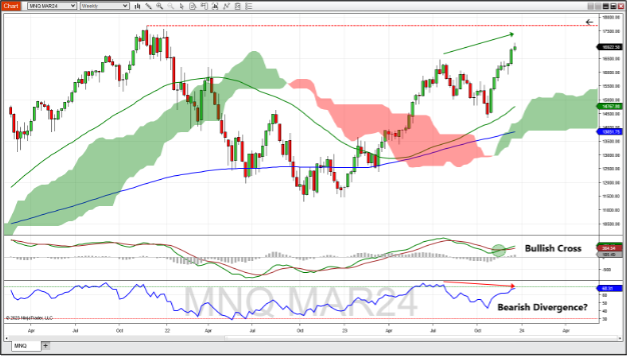
March Micro Nasdaq 100 Index Futures Weekly Chart
March Micro Nasdaq 100 Index futures continued the rally with the eighth consecutive up week. Prices were well above the 52-week and 200-week moving averages along with the top of the Ichimoku cloud. The MACD showed a bullish cross roughly four weeks ago and chose no signs of stopping. RSI on a weekly basis is getting near an oversold level. Although there may be signs of bearish divergence as the Nasdaq price makes new highs, RSI has not made a higher peak high. This could indicate a weakening in the bull trend. If the market continues to rally, look for a target of the high in October 2021 (~17,700). Should this market retrace, the previous high from June 2023 (16,460) could be the next level to find support.

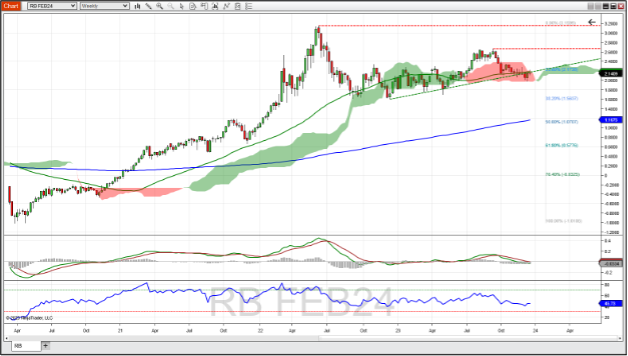
February RBOB Gasoline Futures Weekly Chart
February RBOB gasoline futures continued their sideways motion as price seems to be stuck in the Ichimoku cloud since early October. The 52-week moving average held as resistance like it has for the last month, and price is just trying to get back over the supportive trend line that is defined by the low from October last year to the low from April this year. MACD and the histogram both indicate bearishness. The RSI at 45 is trending along with price. Should resistance hold and this market takes a downturn, look for support at the bottom of the Ichimoku cloud (~2.00) with further support at the 38.2% Fibonacci retracement level of the trend that began in March 2020 and culminated in April 2022 (~1.56). A break above the Ichimoku cloud could experience resistance at the recent high from September (~2.67).

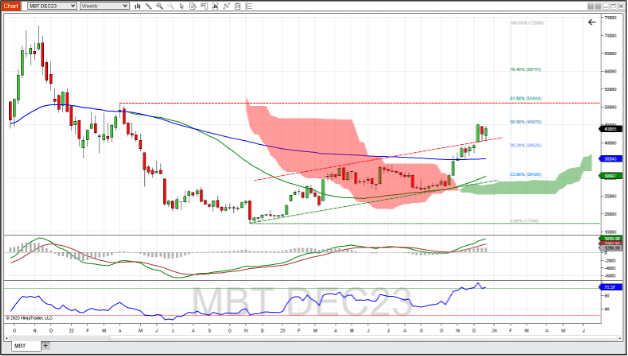
December Micro Bitcoin Futures Weekly Chart
December Micro Bitcoin futures finished higher last week, but came up short in trying to reach the recent high from two weeks ago. Near term trend continues to look bullish as Bitcoin traded above the trend channel that has been in effect since November 2022. The MACD has been bullish since it crossed over its signal line, just as price jumped out of the Ichimoku cloud. RSI remains overbought at 72. Should this bullish trend continue, look for resistance at the 50% Fibonacci retracement level (45,070), and further at the 2022 high of 51,080. A pullback might find support at the 38.2% Fib retracement level (~38,525) and further down at the 200-week moving average (~35,500).

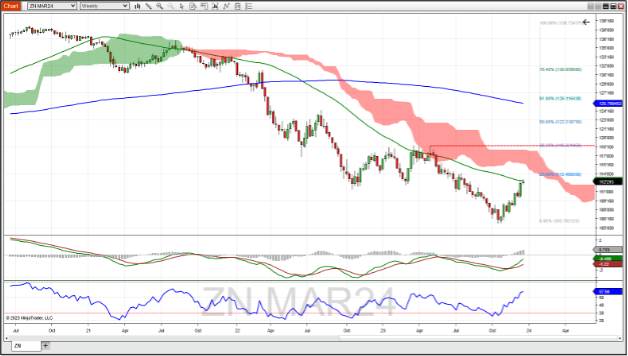
March 10-Year Note Futures Weekly Chart
March 10-year note futures continued their steady March up, finding resistance at the 52-week moving average. While the MACD gave a bullish cross of its signal line a little over a month ago, the MACD itself has yet to cross into positive territory. RSI is trending along with price, but at 57 still has room to move up. Despite being below the Ichimoku cloud and the 200-week moving average, we might be seeing the early signs of a bullish trend. Should the 10-year note continue its uptrend, resistance might be found at the bottom of the Ichimoku cloud (~115’20) and further on up at the 38.2% Fibonacci retracement level (~118’06). A reverse to the downside might find support at the recent low in October (~105’20).

Economic Reports for the week of December 25 – December 29
This week will be a light week in economic news due to the Christmas holiday. House prices from Case Shiller and the FHFA arrive Tuesday morning at 9:00 AM ET and forecasts show a bit of divergence between the two reports.
Case Shiller, which covers prices from 20 cities, is expected to increase from last month (to 5%) whereas the FHFA Home Price Index that measures the entire US is expected to decline from last month to half a percent.
Thursday also sees the Pending Home Sales Index at 10:00 AM ET, which could be a turnaround from negative to positive from last month. Jobless Claims on Thursday morning could be the big mover this week although we do get some information about manufacturing from Richmond, Chicago and Dallas on different days. Because of the shortened week, the EIA Petroleum Status report is moved to 11:00 AM ET Thursday, 30 minutes after the usual Natural Gas report. Happy holidays to all!
| Date | Economic Report |
|---|---|
| Monday, December 25 | Market Holiday: Christmas |
| Tuesday, December 26 | 8:30 AM ET: Chicago Fed National Activity Index 9:00 AM ET: FHFA House Price Index 9:00 AM ET: Case-Shiller Home Price Index 10:30 AM ET: Dallas Fed Manufacturing Survey * 11:00 AM ET: Export Inspections 1:00 PM ET: Money Supply 4:30 PM ET: API Weekly Oil Stocks |
| Wednesday, December 27 | 10:00 AM ET: Richmond Fed Manufacturing Index @RichmondFed * 11:00 AM ET: Survey of Business Uncertainty @AtlantaFed |
| Thursday, December 28 | 8:30 AM ET: Jobless Claims *** 8:30 AM ET: International Trade in Goods (Advance) 8:30 AM ET: Retail Inventories (Advance) 8:30 AM ET: Wholesale Inventories (Advance) 10:00 AM ET: Pending Home Sales Index 10:30 AM ET: EIA Natural Gas Report 11:00 AM ET: EIA Petroleum Status Report 11:00 AM ET: Kansas City Fed Manufacturing Index 4:30 PM ET: Fed Balance Sheet |
| Friday, December 29 | 8:30 AM ET: Export Sales 9:45 AM ET: Chicago PMI * 1:00 PM ET: Baker Hughes Rig Count 3:00 PM ET: Farm Prices |
*** Market Moving Indicators
* Merit Extra Attention
Ready For More?
Learn the basics of technical analysis with our free multi-video trading course, “Technical Analysis Made Easy.”
Join our daily livestream events as we prepare, analyze and trade the futures markets in real time.
Start Trading Futures With NinjaTrader
NinjaTrader supports more than 800,000 futures traders worldwide with our award-winning trading platforms, world-class support and futures brokerage services with $50 day trading margins. The NinjaTrader desktop platform is always free to use for advanced charting, strategy backtesting, technical analysis and trade simulation.
Get to know our:
- Futures brokerage: Open an account size of your choice—no deposit minimum required—and get free access to our desktop, web and mobile trading platforms.
- Free trading simulator: Sharpen your futures trading skills and test your ideas risk-free in our simulated trading environment with 14 days of livestreaming futures market data.
Better futures start now. Open your free account to access NinjaTrader’s award-winning trading platforms, plus premium training and exclusive daily market commentary.

