Volume Profile is an advanced order flow study which displays volume distribution at price over time. Displayed on a chart as a horizontal histogram, Volume Profile can help reveal significant price levels including support & resistance.

See Volume at Price for More Insight
A key component in the technical analysis of futures, volume is commonly used as a charting indicator displaying the total number of contracts traded within a specified period of time. Volume can be further segmented into buying volume and selling volume helping traders identify imbalance in the markets.
Prior to the emergence of Volume Profile, volume data had been confined to the x-axis and displayed as a histogram in a panel below price information.

Pictured above is price action in Micro E-mini S&P 500 futures (MES) on a 60-minute timeframe. A traditional volume indicator is plotted in the panel below the price bars.
Volume Profile is essentially volume data displayed on the chart horizontally in the same chart panel as price data. The ability to see volume at corresponding price levels provides further insight to how a market reached its current price and, more importantly, where it might move next.

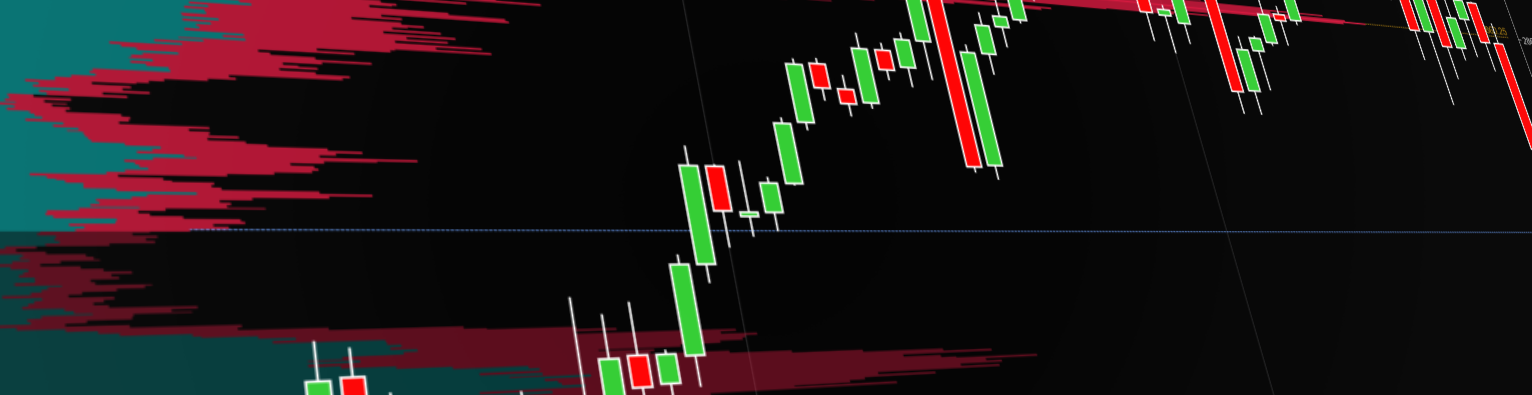
In the chart above, Volume Profile indicates two significant price levels for traders to consider as possible inflection points or support/resistance zones. Furthermore, with display mode “Buy Sell” selected, Volume Profile reveals the split between aggressive buying & selling behavior at each price level.
Volume Profile vs Market Profile
While Volume Profile is sometimes used interchangeably with Market Profile, there are important differences to consider. While Market Profile indicates how long price traded at each level, Volume Profile shows how much volume was traded there.
Since it’s volume – buying & selling – and not time that moves markets, Volume Profile is considered more of a “true” technical analysis study by many traders.
Volume Profile Breakdown
Below are common levels of signifiance within a Volume Profile:

- Point of Control (POC) – The price level with the highest traded volume within the profile, represented with a yellow horizontal line.
- Profile Low – The lowest traded price within the specified time period.
- Profile High – The highest traded price within the specified time period.
- Value Area – The range within the profile where the most volume traded. The value area high and low are also considered significant levels within a Volume Profile.
Once familiar with Volume Profile, traders can leverage this powerful tool help detect support and resistance levels, price reversals and more. As each individual trader’s approach to markets is different, Volume Profile can be applied in various methodologies to assist with technical analysis.
Get Started with Order Flow +
Volume Profile is included with NinjaTrader’s Order Flow + suite of premium technical analysis tools. It features 3 profile modes, 6 display modes and can be applied to charts as both an indicator and drawing tool.
Current NinjaTrader users can get started with Volume Profile and the rest of the Order Flow + suite today: Learn More.
New to NinjaTrader? Our award-winning trading software is always FREE to use for advanced charting, backtesting and trade simulation. Get started with our free trading platform today!
