You may have heard analysts and traders discussing moving averages when talking about a particular market in a chart. So, what is a moving average? A moving average is a key technical indicator used by traders of all levels. But how is it calculated, and why is this seemingly arbitrary curvy line so important to so many traders?
Moving averages are statistical calculations used to plot the average price of a market, for a user-defined timeframe and bar interval, on a chart. This helps smooth out the choppy price action and allows a trader to better identify short- and long-term trends, support and resistance levels, and potential trade setups.
Learn How to Apply Moving Averages to Your Futures Trading Strategy
Moving averages play a significant role in technical analysis by smoothing price data to help recognize trends within a futures market, identify support and resistance areas, and provide valuable insights into changes in market direction—all to help futures traders make better informed decisions. Whether you use one or more averages on a chart or use simple or exponential, an understanding of how to interpret moving averages is a vital skill for anyone active in the world of futures trading.
How to Calculate a Moving Average
A simple moving average (SMA) is calculated by taking the close of each bar for a given lookback, summing those closes, then dividing by the lookback period: SMA = SUM (prices over time) / n-periods. The moving aspect of the average reflects the nature of the calculations: starting with the oldest data in the chart and moving forward, as each new bar is added to the calculation, the oldest bar drops out.
Determining the Trend
Moving averages are one of the most widely used technical indicators for trend identification. Traders will often use one or more moving average lines to identify a trend for different time frames. The visual slope of a moving average identifies the trend direction: an upward slope is bullish, and a downward slope is bearish.
When using two or more moving averages, the intersection of a shorter term (faster) moving average with a longer term (slower) moving average often signals a change in trend direction. For example, the "golden cross" is considered a significant pattern, occurring when the faster 50-day SMA crosses above the slower 200-day SMA, indicating a strong bullish shift in trend.
Nature of Moving Averages
The length of the moving average lookback (timeframe) determines how reactive the moving average indicator is to the historical and real-time price action. The greater the number of bars in the calculation, the slower the average will adjust to changes in trend. Common moving average lookbacks are 10, 20, 50, and 200.
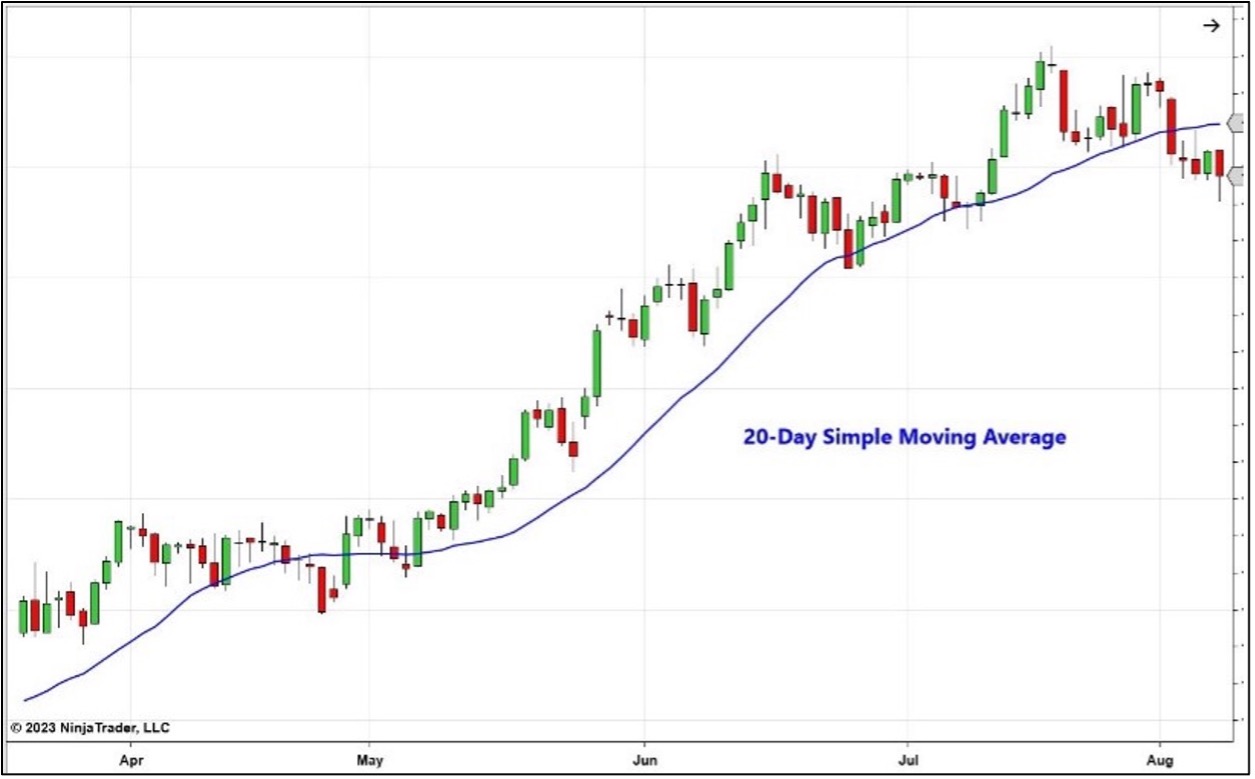
Using a 10-bar SMA will help detect short-term trends, while a 50-bar SMA will identify long-term trends. Moving averages tend to lag the price action, which means the market will have made a significant move prior to the slope of a moving average identifying the new trend. (Figure 1)
Support and Resistance Levels Many traders will use moving average levels as entry and exit order prices, which can establish and reinforce an average line as a strong support or resistance level. When prices are moving down and approaching a moving average from above, the moving average may act as support. If prices are moving up and approaching the moving average from below, the moving average may act as resistance. (Figure 2)
Prices may pause or test a moving average support or resistance level by touching or crossing the moving average line for one or more bars before establishing the new trend. The same moving average can act as both an area of support or resistance as prices fluctuate above and below the average.
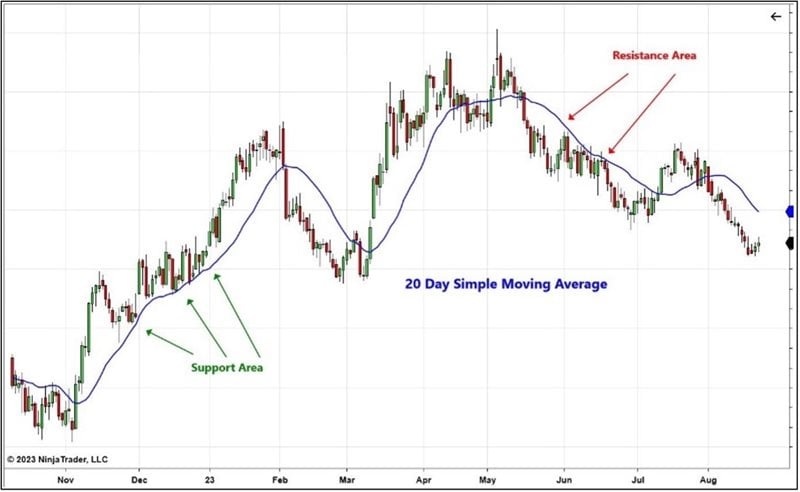
Figure 2: 20-Day Simple Moving Average Acting as Support and Resistance
Identifying Trend Reversals and Trading Opportunities
When price crosses a moving average or when two moving averages cross over each other, these events are interpreted as a reversal (or change in trend direction or bias) from the previous trend. These crosses are fairly rare events and often occur at peaks and valleys in a chart after a strong directional price change. They are often used as entry and exit triggers in conjunction with other trading rules and risk management. For example, a trader may use a 20-period SMA crossing above the 50-period SMA to enter a long position. (Figure 3)
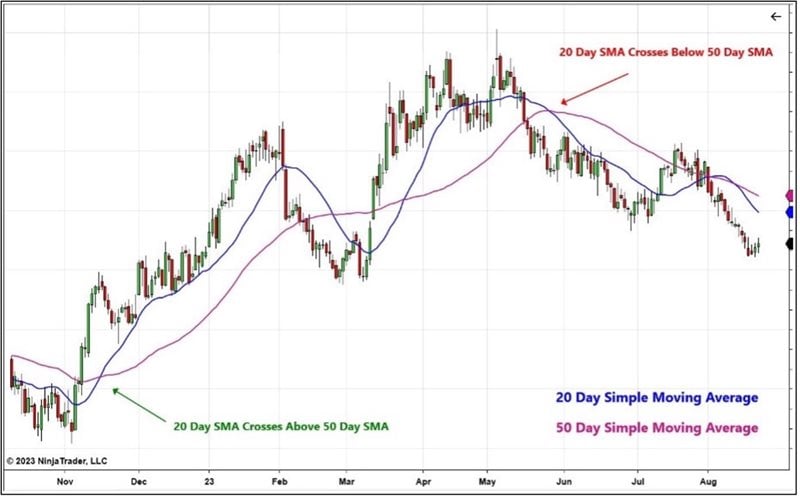
Figure 3: 20-Day Simple Moving Average Crossing 50-Day Simple Moving Average
It’s important to note here that the bar interval in the chart plays a critical role in determining the stability and reliability of the moving average trend. A one-minute bar can be more volatile and random than a daily or weekly chart, which can reduce the confidence (or reliability) of the trend signal.
Beyond Simple Moving Averages
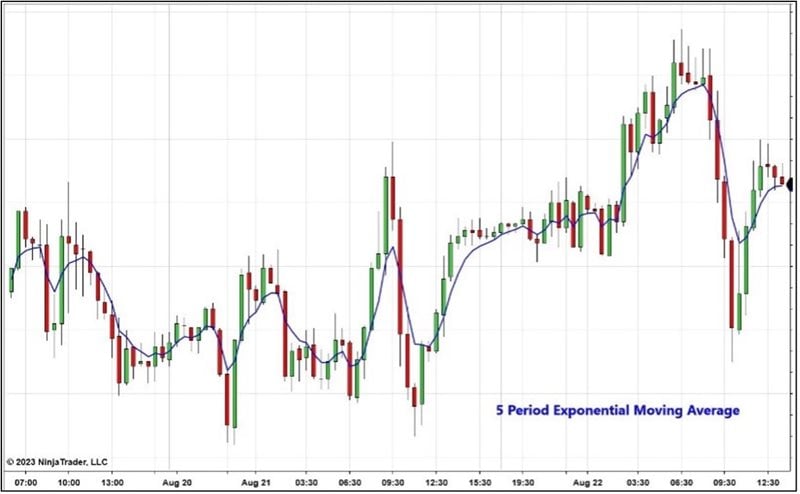
In addition to the SMA, there are several other moving average calculations that are popular with traders. The exponential moving average (EMA) is a recursive calculation that puts more weight on the most recent prices. This has the benefit of reacting more quickly to the most recent price movements than an SMA, especially when applied to intraday charts. (Figure 4)
Unlock Free Exclusive Training to Level Up Your Trading
Explore the foundational concepts of technical analysis with our free multi-video trading course “Technical Analysis Made Easy.” Learn how to analyze and anticipate market movements using market prices, volume data and more. To access this and other exclusive on-demand courses and educational content, sign up for your free NinjaTrader account today.
Plus, watch our daily livestream events as we prepare, analyze and trade futures markets in real time.
