It’s easy to make connections between modern digital trading and the advanced technical analysis methods traders implement. However, candlestick pattern recognition is one of the earliest forms of technical analysis, dating back to the 18th century in Japan. Munehisa Homma, a famous rice merchant from Sakata, Japan is rumored to be the “Father of the Candlestick Chart” using candlestick patterns hundreds of years ago to identify and predict the behavior of rice markets at the time.
Learn about candlestick charts and candlestick pattern recognition with this quick video!
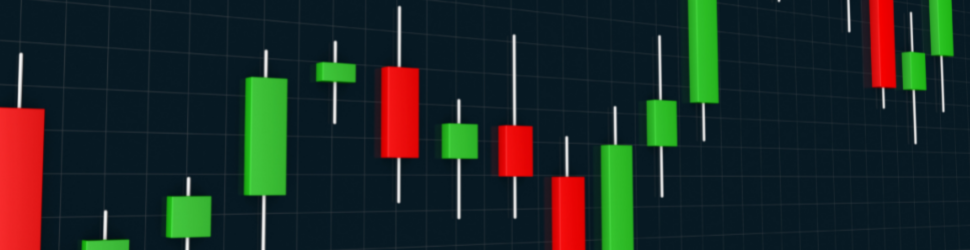
Anatomy of a Candlestick Chart
Candlesticks represent each user defined time period with more than just a single price point. The unique design of this chart type provides a quick look at the open, high, low, and close of each time period, helping to paint a more vivid picture of overall market sentiment.
There are 2 main parts of a candlestick – the body and the wicks, which are also known as shadows or tails. The wide body of each candle is formed between the opening and closing prices of the bar. If there is a decrease in price and the open is higher than the close, the candle body is filled in red. If there is an increase in price and the candle closes higher than it opened, the candle body is filled in green.

The wicks of the candle extend from the body to the highest and lowest prices recorded between opening and closing. Since it is possible for the high and low prices to be identical to the open or closing prices, not all candlesticks have wicks. Additionally, the open and close can be identical, meaning a candle will have a flat line as a body sometimes. This can create a wide array of candlestick shapes which traders can use to identify various market conditions.

Identifying Candlestick Patterns
Some traders and technical analysts look to various candlestick shapes and patterns to make predictions about a particular market movement. Simple patterns consist of just a single candlestick with a distinct shape. This is a great place to start for new traders interested in reading candlestick patterns. Candlesticks include shapes such as “morning star”, “hammer” and “Doji”. Complex patterns involve multiple candlesticks worth of data. The candlestick pattern indicator within NinjaTrader offers over 20 simple and complex patterns, which are automatically recognized and plotted on a chart based on various pattern rules.

Add Candlestick Patterns to a Chart:
-
Right click on any NinjaTrader chart and select “Indicators”
-
Locate “Candlestick pattern” from the top left list, and click “add” below
-
From the right-side configuration menu, select the pattern you’d like NinjaTrader to find on your chart. Click “OK”
All the instances of selected patterns will be highlighted, labeled and numbered on the chart, making it easy to identify all your favorite candlestick patterns and explore new ideas with different patterns.
Additionally, it’s possible to add more than one candlestick pattern indicator to the same chart if you are looking for multiple candlestick patterns at the same time. A good example is spotting both bullish and bearish engulfing candles within a given time-frame. Combining candlestick patterns with other technical analysis tools, such as moving averages, Fibonacci, and volume, can help to shed more light on market sentiment.
While the topic of candlestick pattern recognition is extensive, hopefully this video and quick read has encouraged you to try out NinjaTrader’s candlestick patterns indicator for yourself, and start identifying these traditional and long-established price formations on your charts.
Get Started with NinjaTrader
NinjaTrader supports more than 800,000 traders worldwide with a powerful and user-friendly trading platform, discount futures brokerage and world-class support. NinjaTrader is always free to use for advanced charting & strategy backtesting through an immersive trading simulator.
Download NinjaTrader’s award-winning trading platform and get started with a free trading demo with real-time market data today.
