One of the classic candlestick charting patterns, a hammer is a reversal pattern consisting of a single candle with the appearance of a hammer. Identifying hammer candlestick patterns can help traders determine potential price reversal areas.
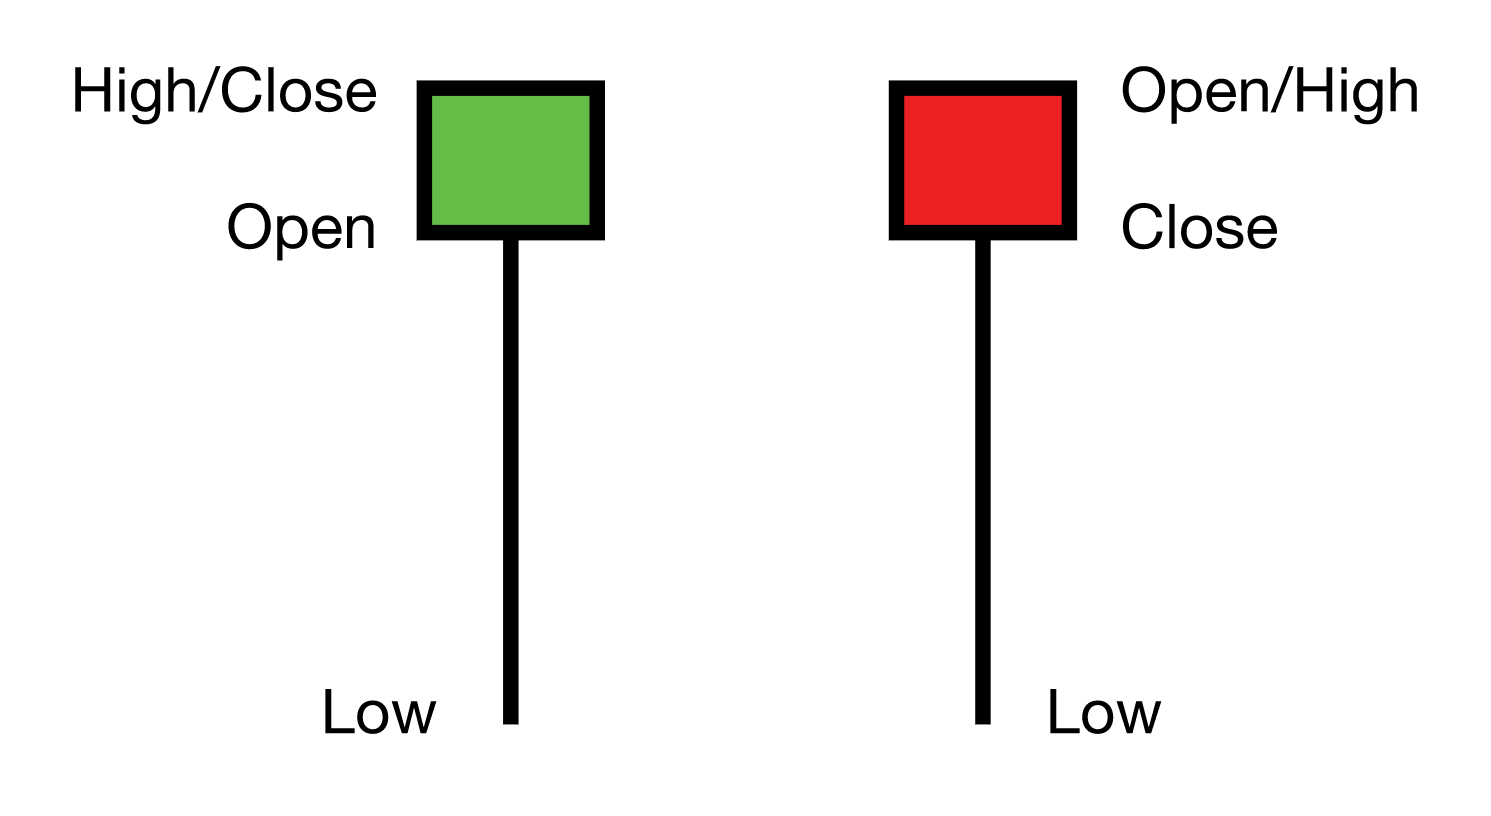
Hammer candles are formed when the open, high and close are similar in value, but a long wick, or shadow, indicates that the price reached significantly lower values before the candle closed. Hammer candles can appear as either red or green candles, with the most qualifying factor being the ratio of the shadow to the body of the candle. The accepted standard among technical traders is that the wick below the body of the candle be at least 2 times as long.
Hammer candles can occur on any timeframe and are utilized by both short and long term traders.
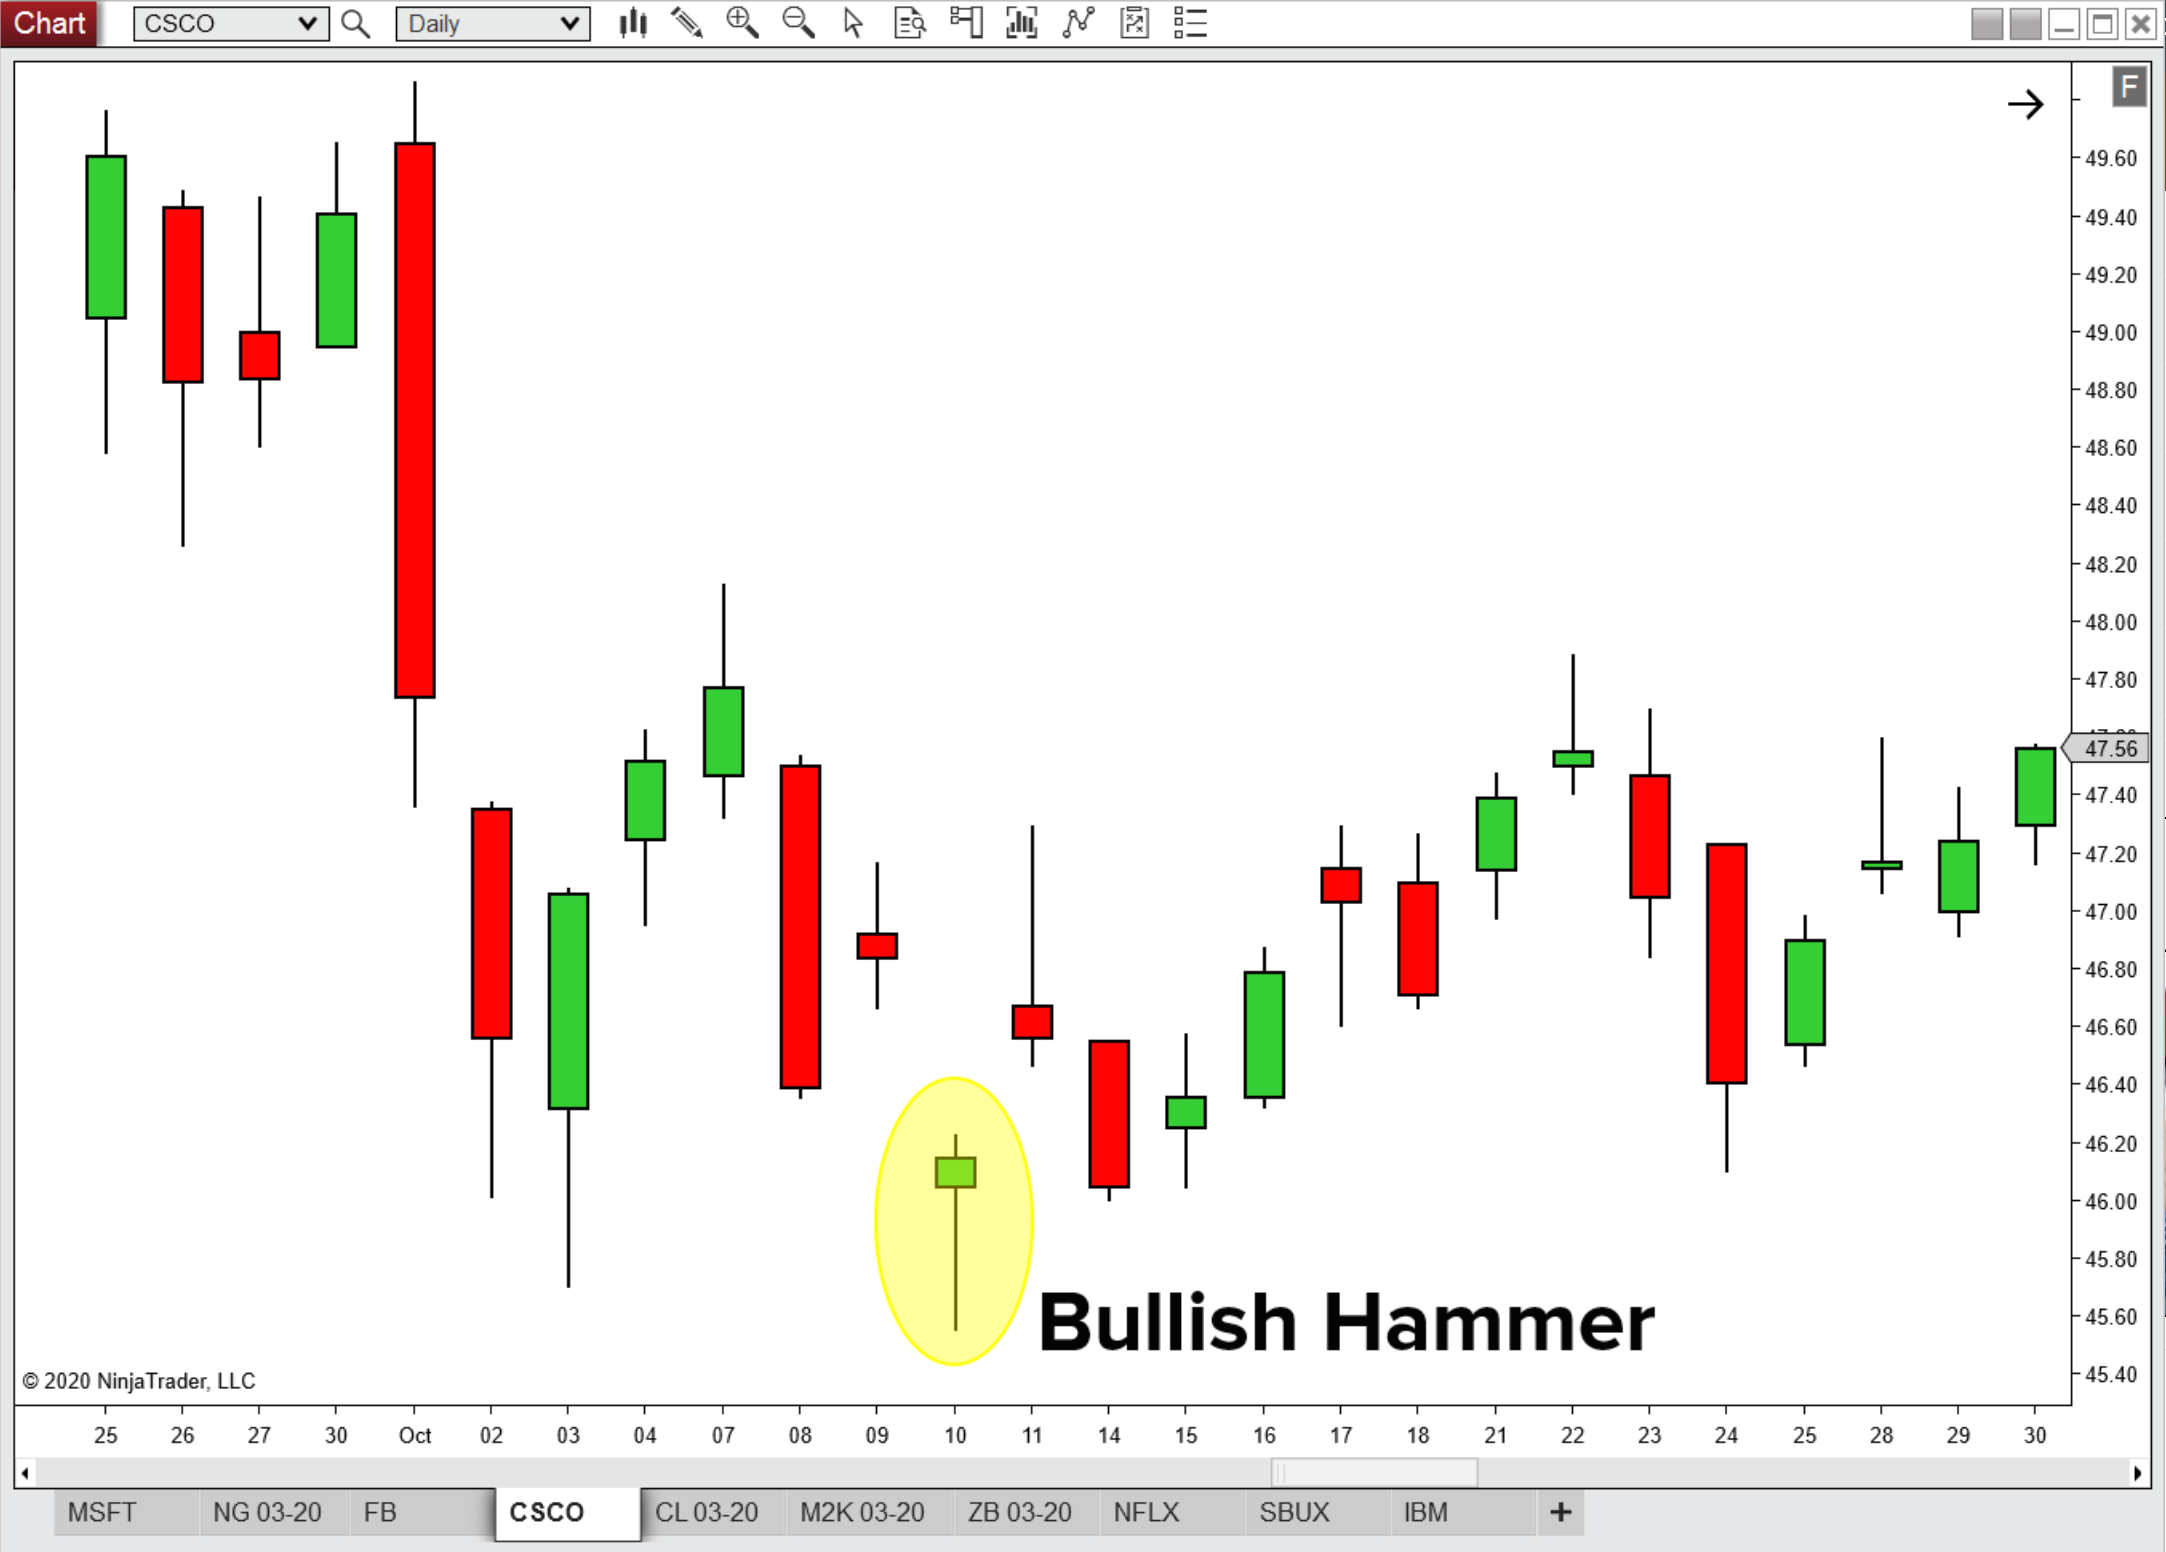
Bullish Hammer
In the example below, a hammer candle can be spotted on the daily Cisco Systems (CSCO) chart and price begins to change direction immediately following.
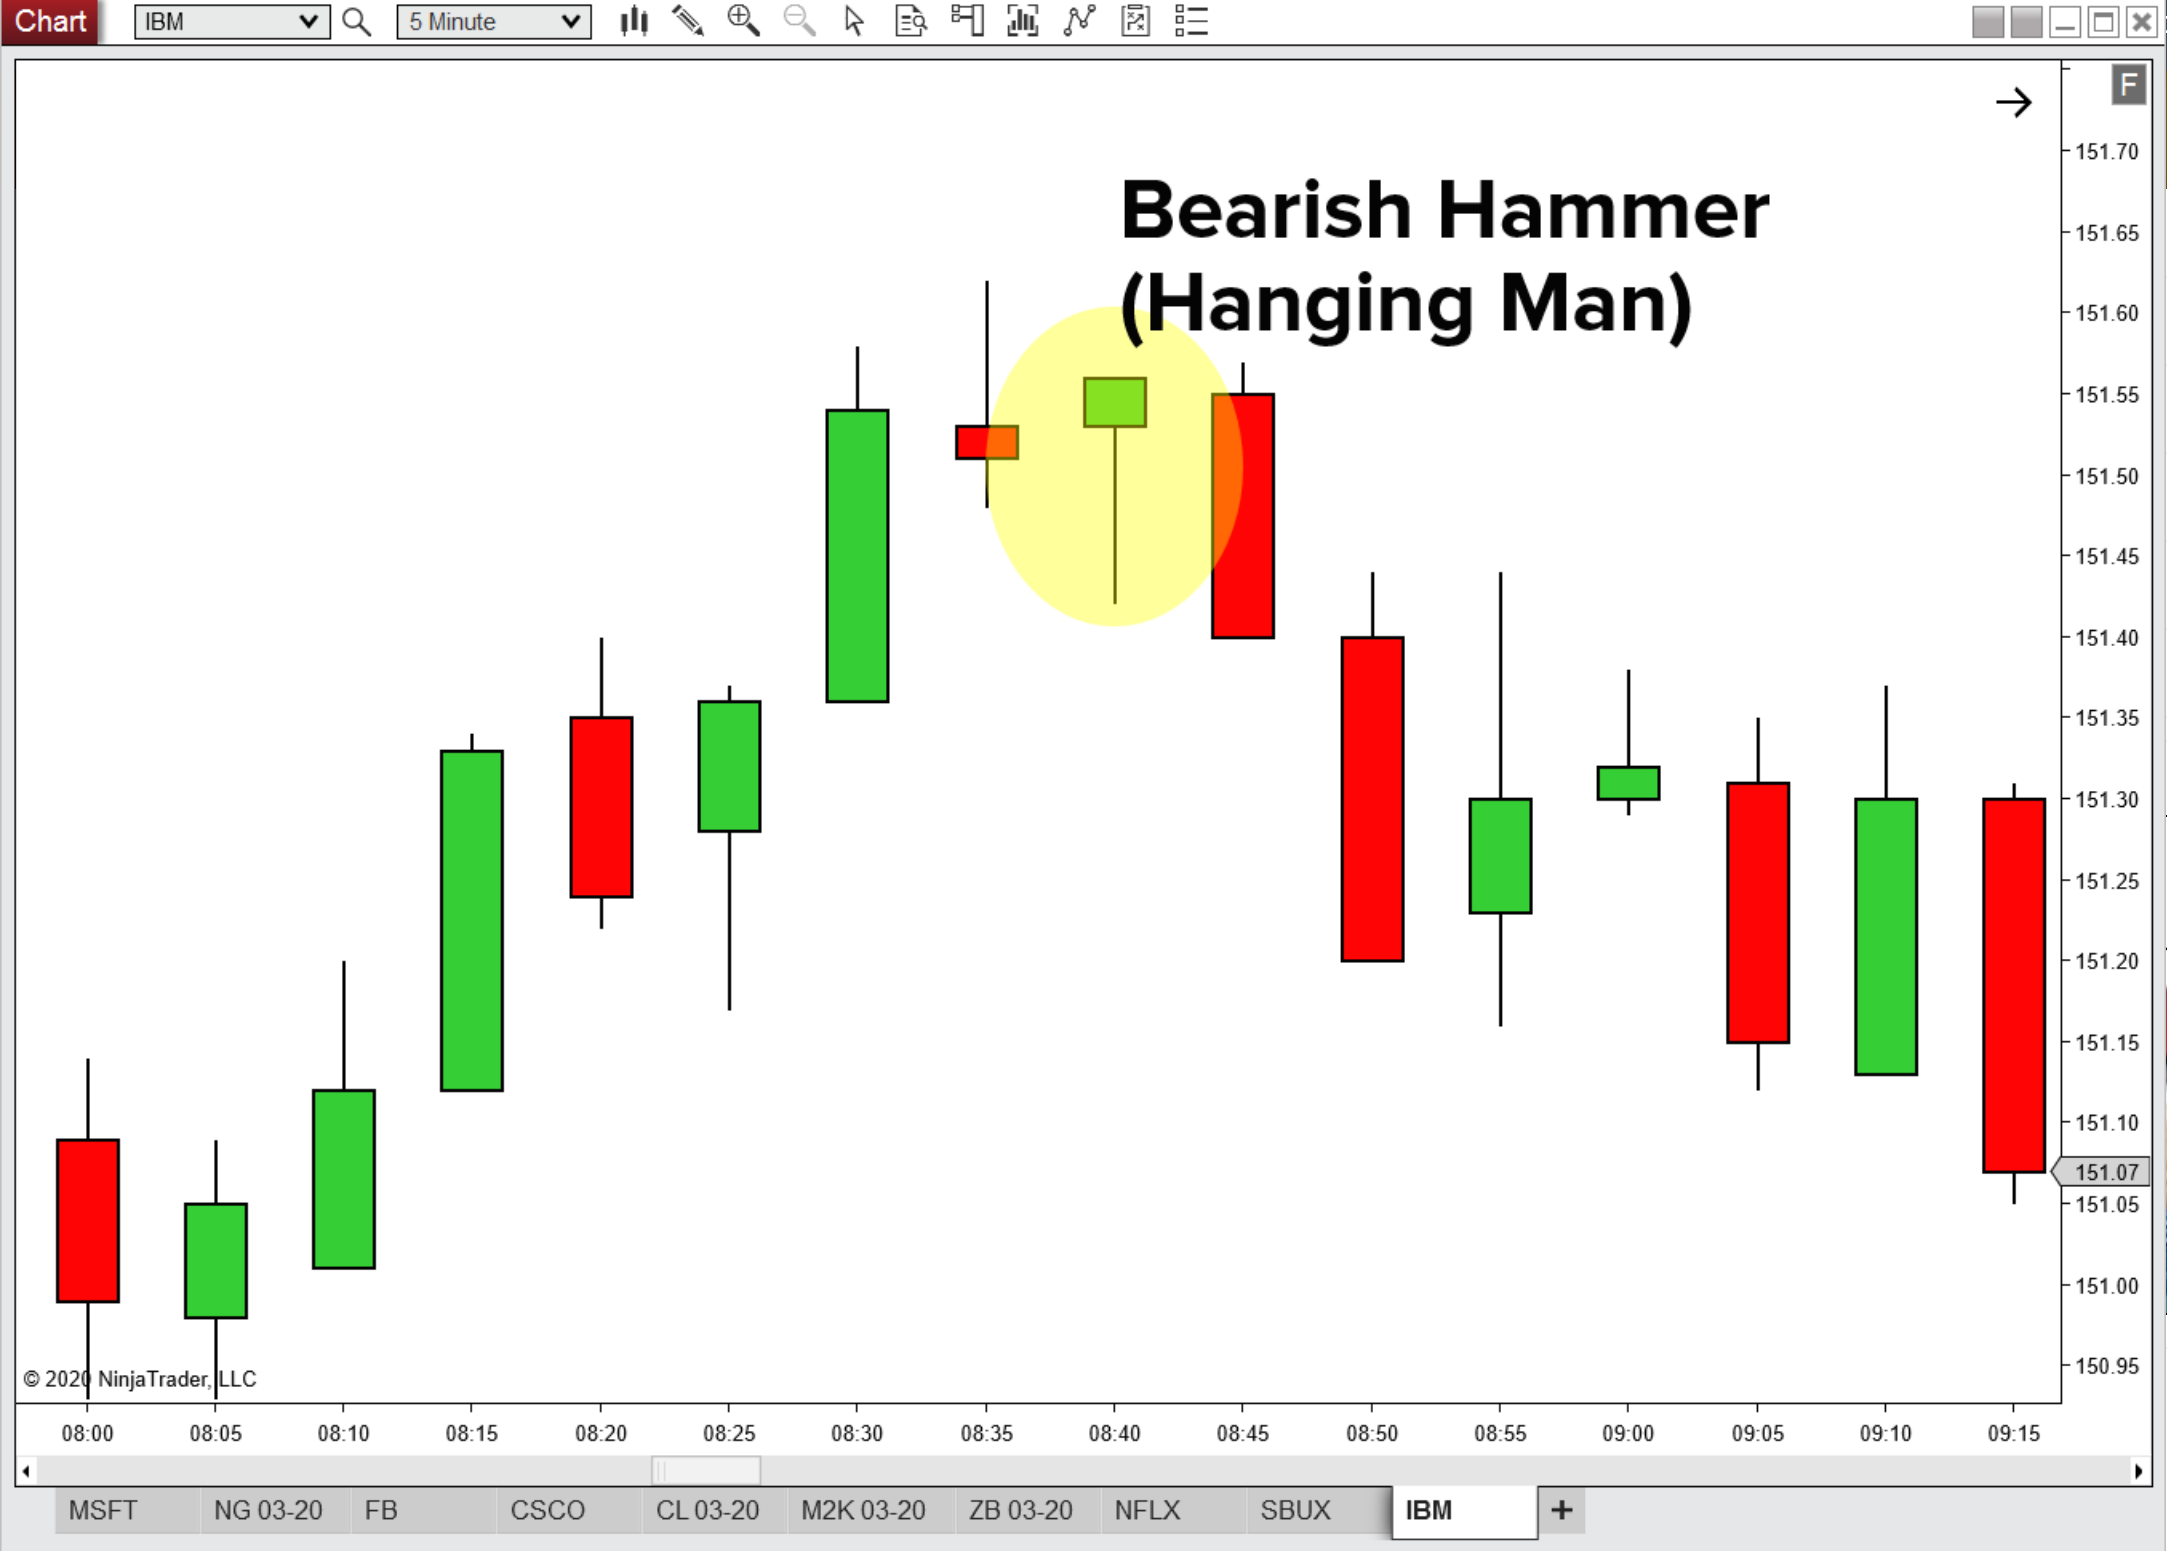
Bearish Hammer (Hanging Man)
When a hammer candle indicates a bearish reversal, it is known as a hanging man. In the example below, a bearish hammer candle appears towards the top of an uptrend on a 5-minute IBM chart and price moves downward following the pattern.
Inverted Hammer Candles
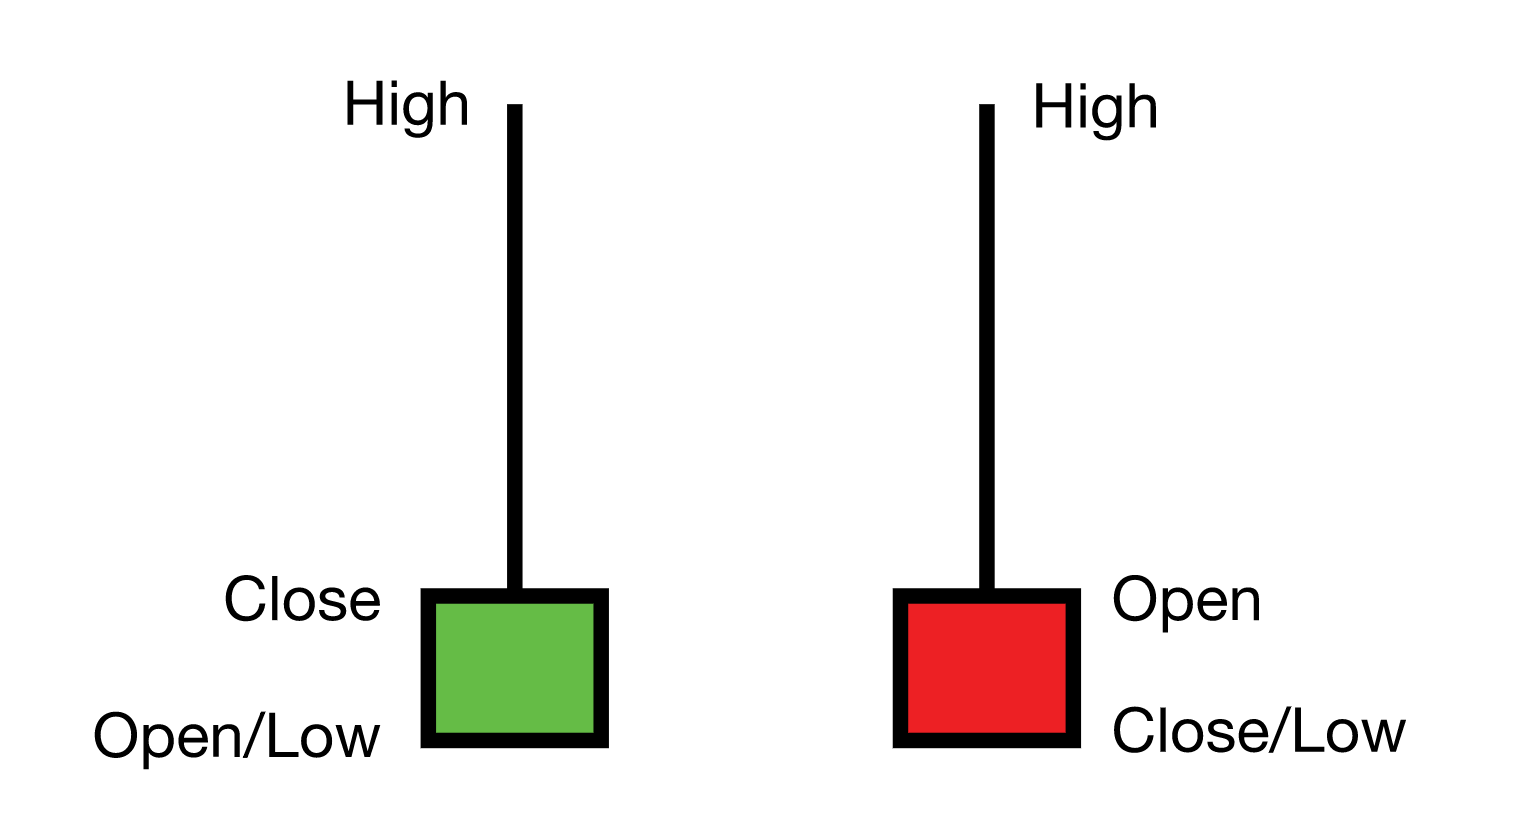
Inverted hammer candles form when the open, low and close of the candle are similar in value but price reached higher values before the close of the candle. Similar to traditional hammer candles, they can occur as both green and red candles and help to identify price reversals.
Bullish Inverted Hammer
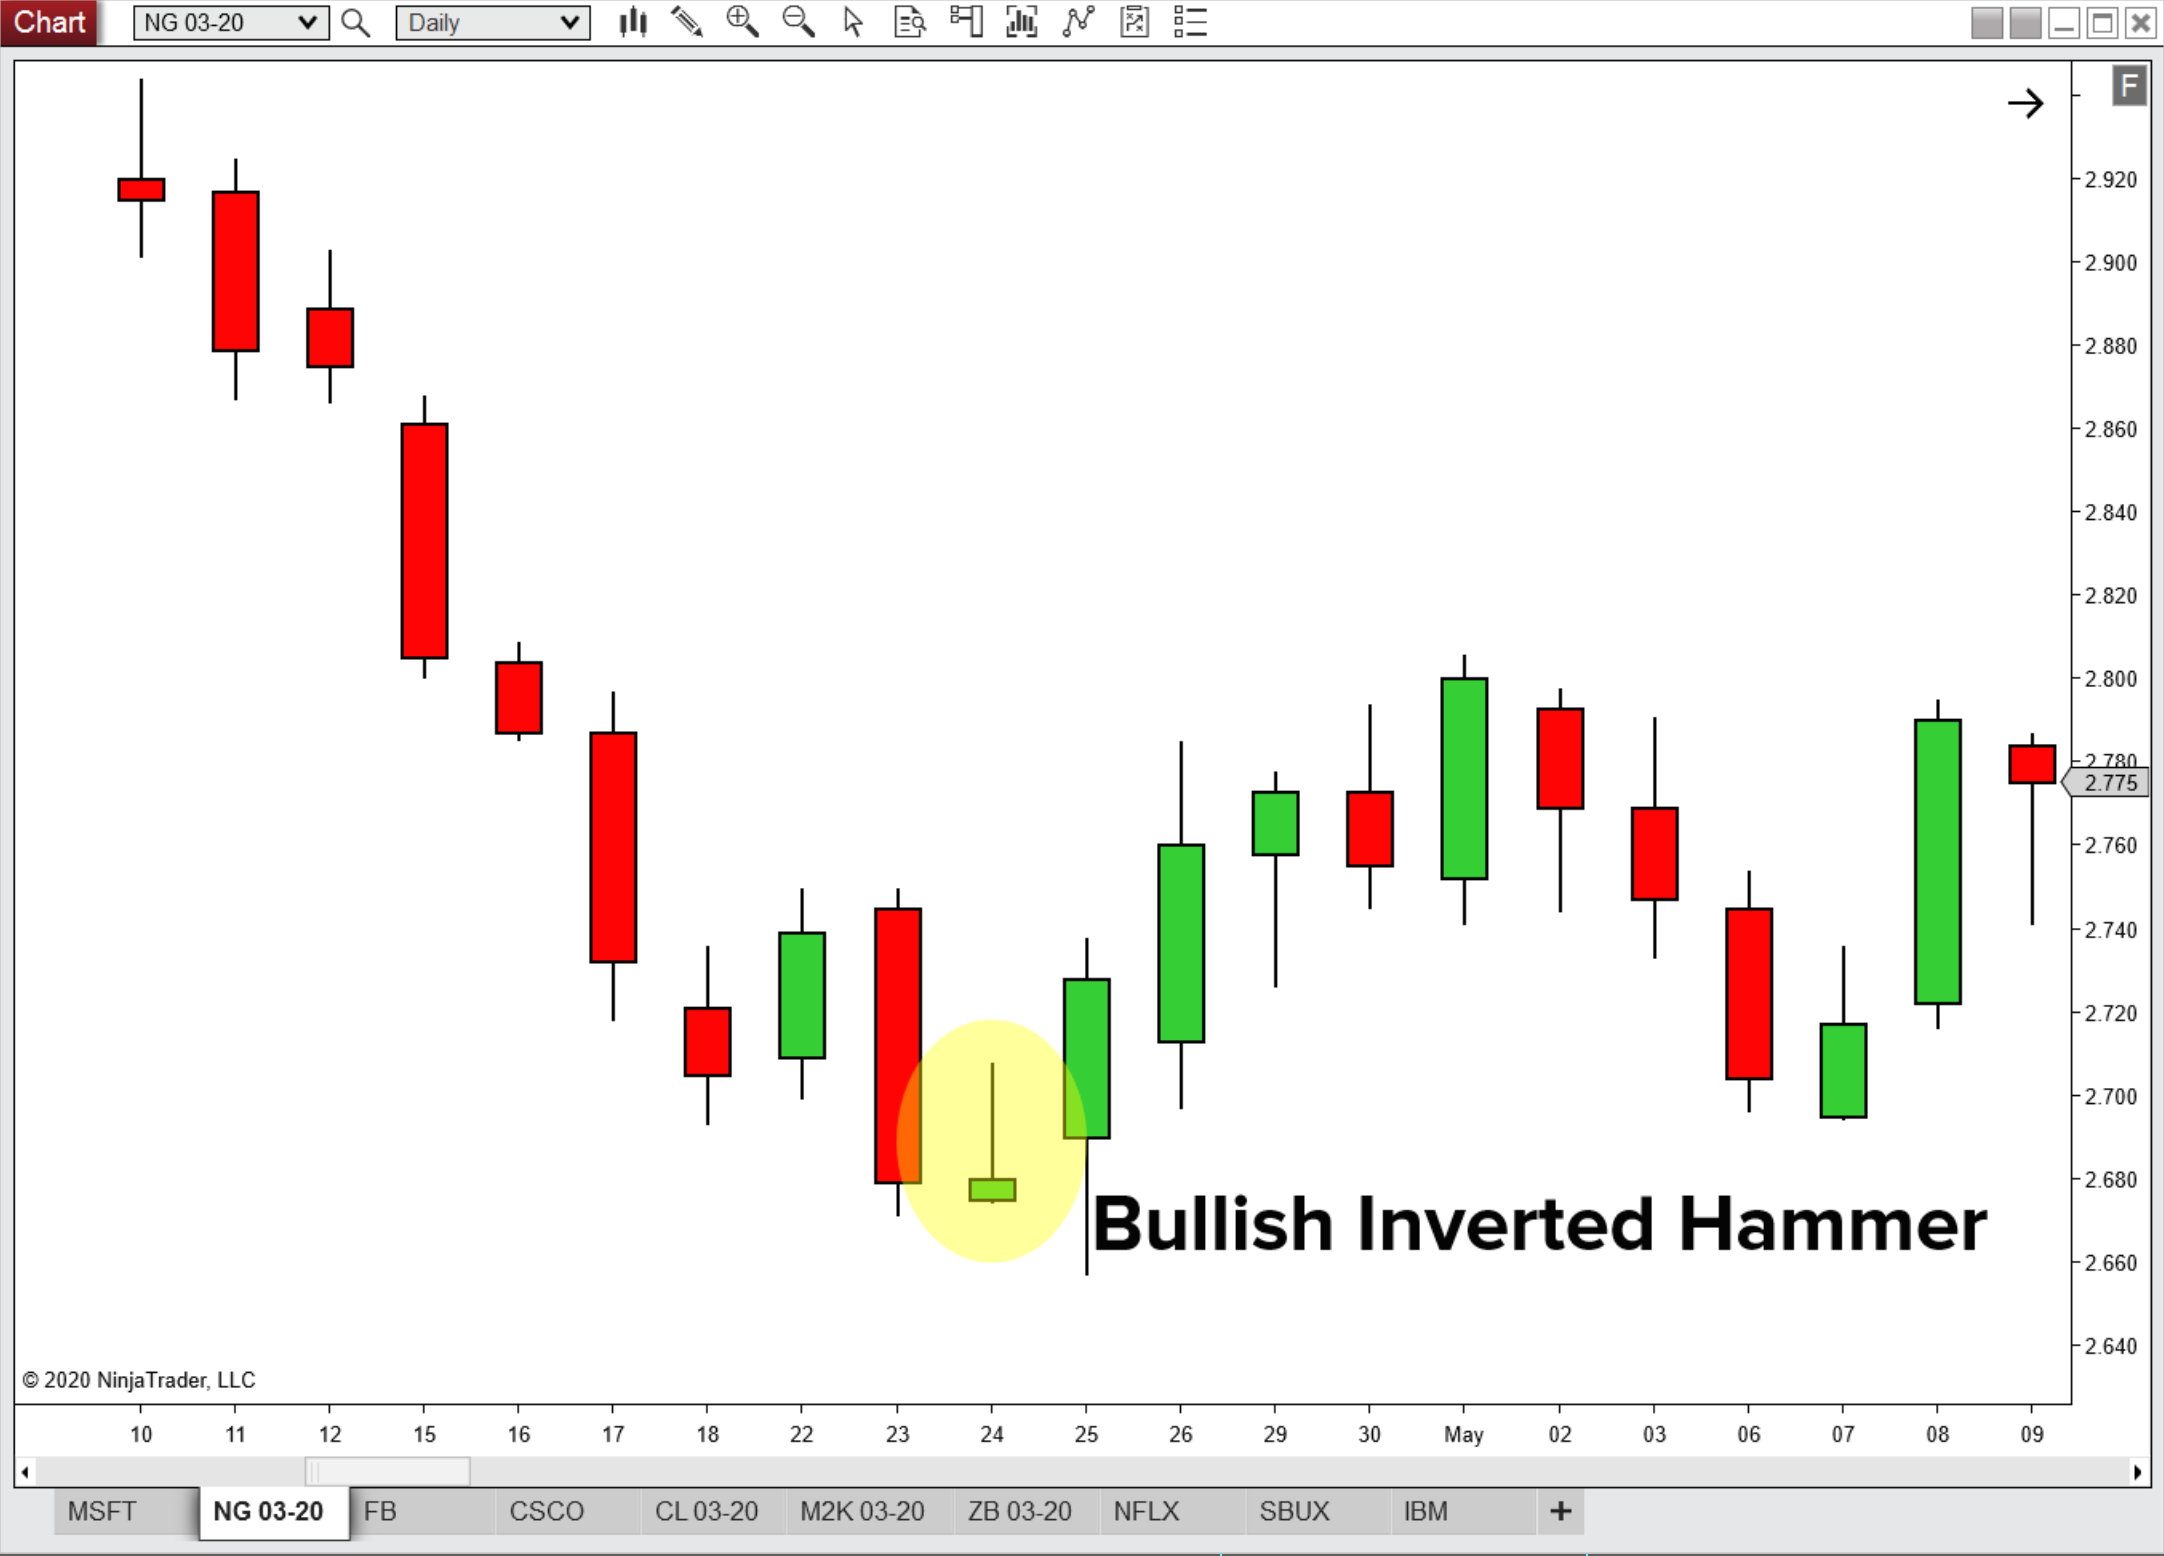
In the example below, an inverted hammer candle is observed on the daily Natural Gas Futures chart and price begins to change trend afterwards.
Bearish Inverted Hammer (Shooting Star)
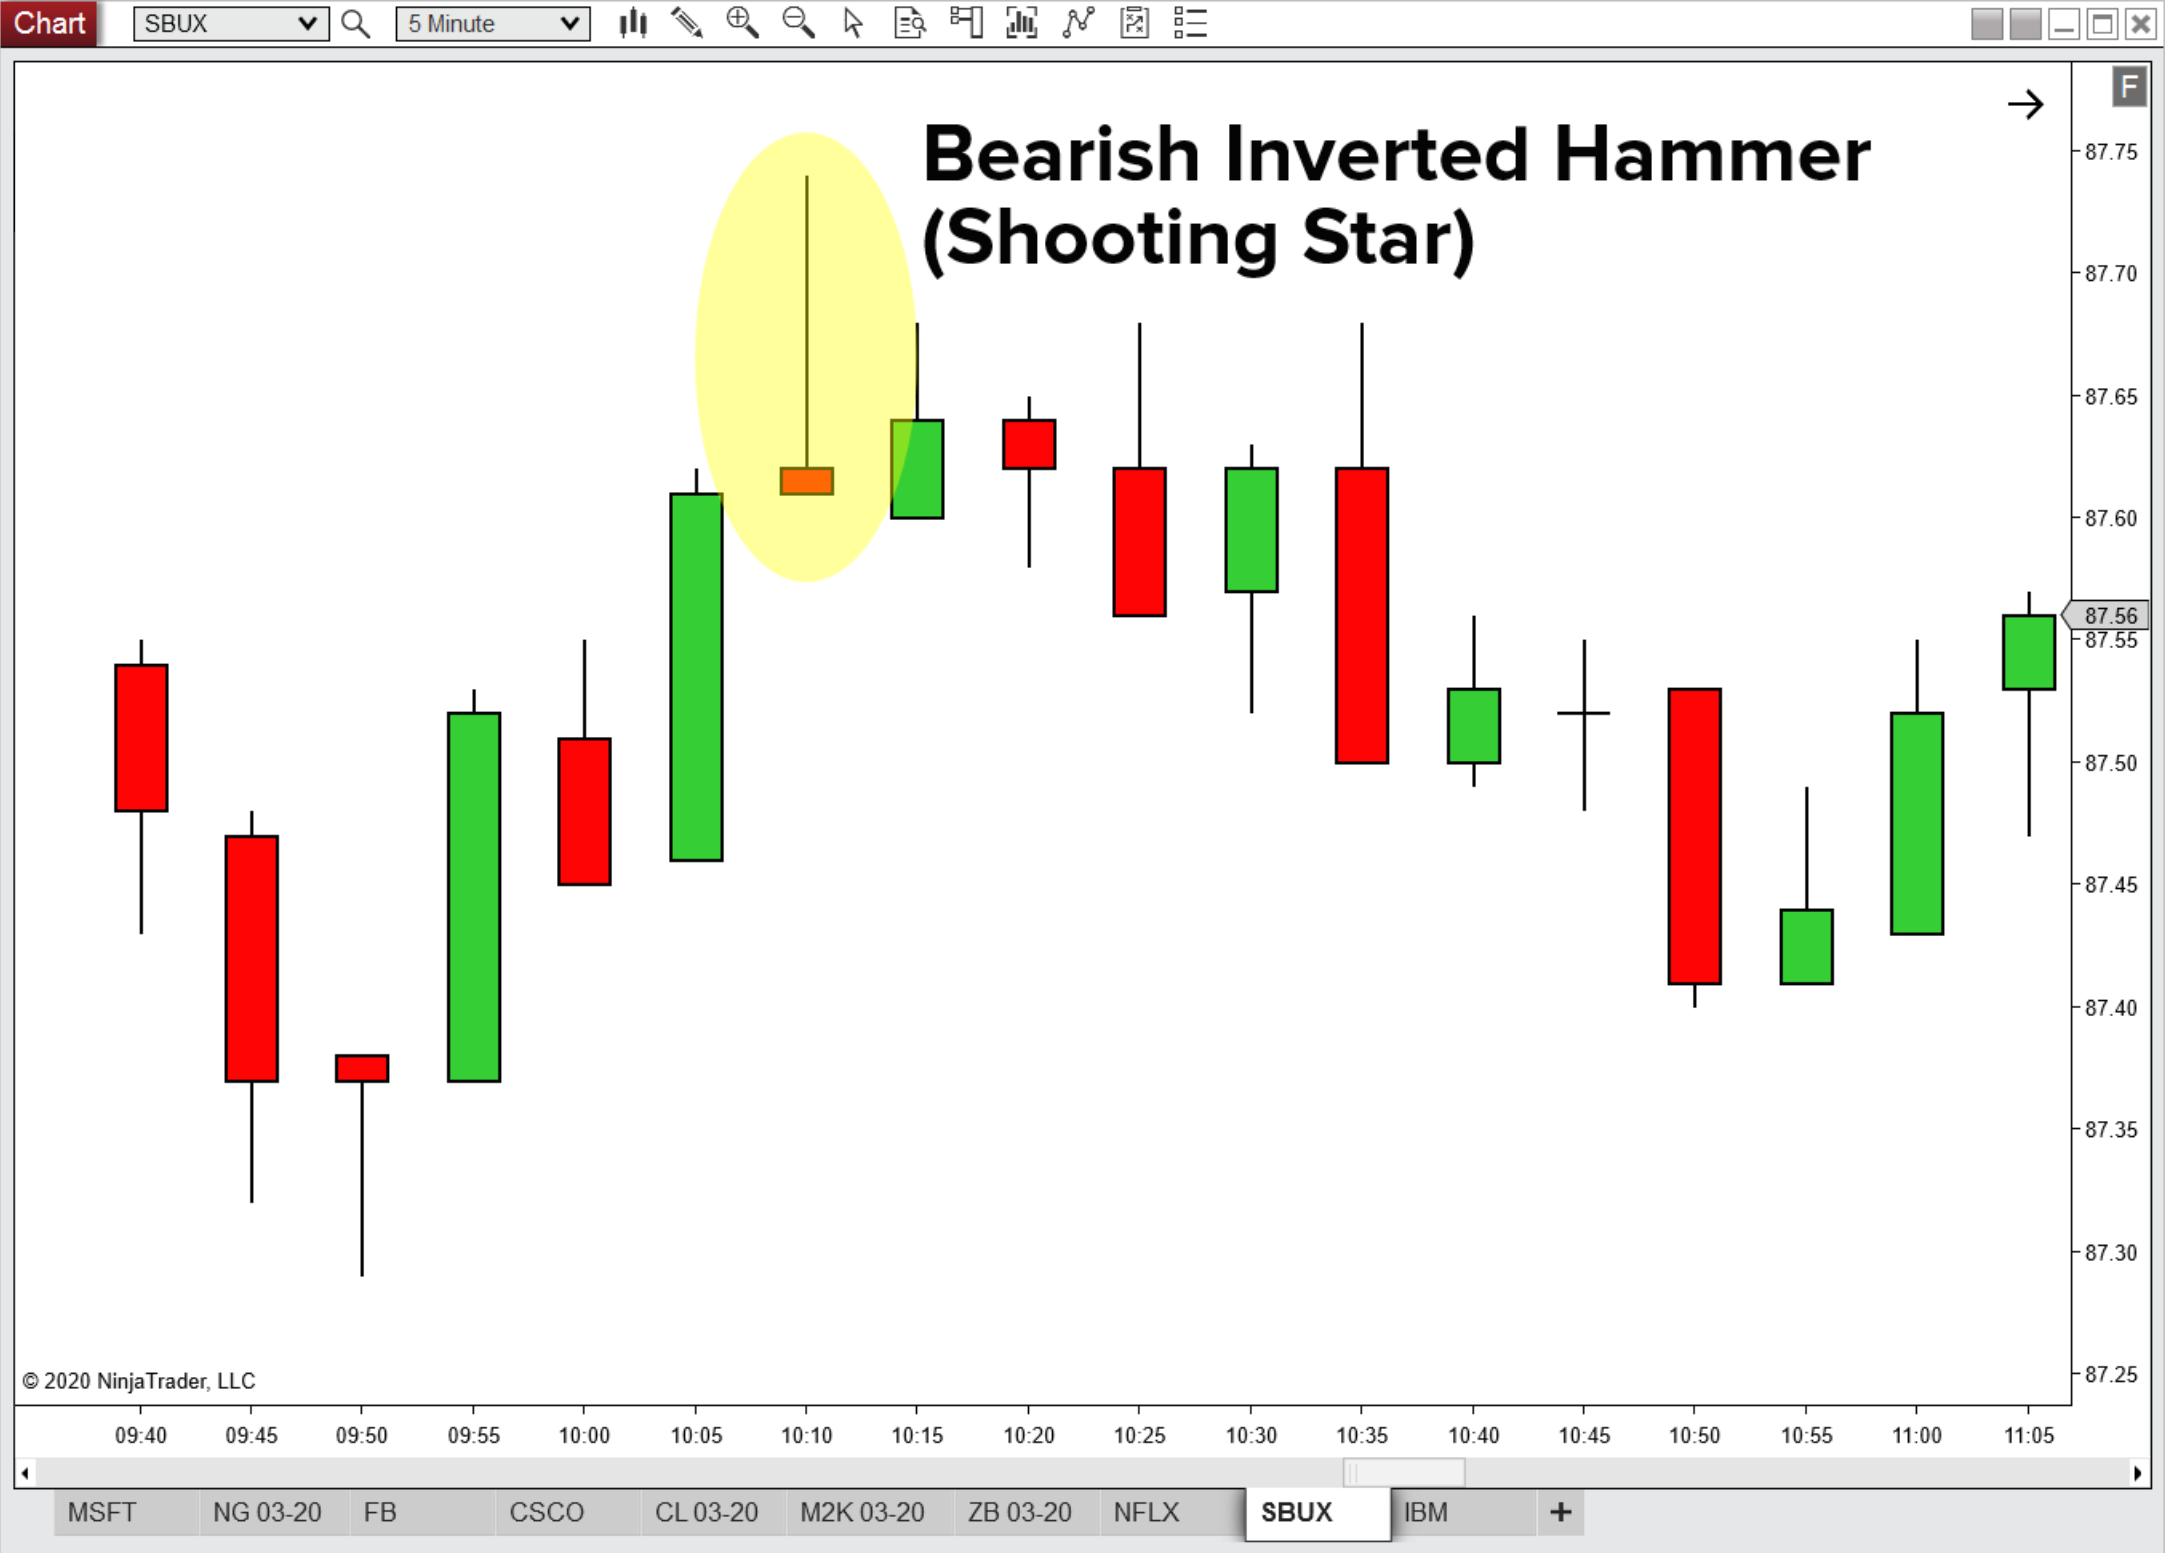
When an inverted hammer candle is observed after an uptrend, it is called a shooting star. In the 5-minute Starbucks (SBUX) chart below, a bearish inverted hammer denotes a change in trend.
Limitations of the Hammer Candlestick Pattern
While the hammer candlestick pattern can be useful to traders of all instruments and timeframes, it can be unreliable as a standalone analysis tool. Confirmation with other indicators and market analysis tools can help to confirm or deny a trade thesis based on a hammer candle.
Difference Between Hammer Candle & Doji
A doji is a similar type of candlestick to a hammer candle, but where the open and close price of the bar are either the same or very close in value. These candles denote indecision in a market and can signal both price reversals and trend continuations.
Get Started with NinjaTrader
In addition to multiple chart styles, bar types and drawing tools, NinjaTrader is equipped with over 100 built-in trading indicators to assist in your technical analysis of the markets. Join the world of market charting & trading analysis and download the award-winning NinjaTrader trading platform today!

