In this week’s coverage, we analyze the recent uptrend in the heating oil market, stalls in the E-mini S&P 500 Index and gold futures charts, and the downtrend in the British pound. We also examine the economic reports expected next week.
Commentary and charts reflect data at the time of writing. Market conditions are subject to change and may not reflect all market activity.
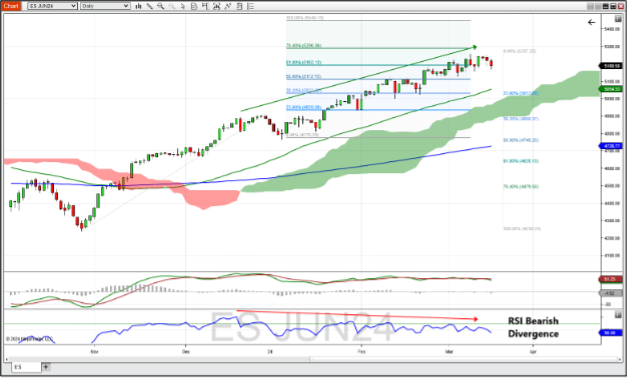
June E-Mini S&P 500 Index Futures Daily Chart
June E-mini S&P 500 Index futures continued to pull back last week, testing support of the trend channel that began at the beginning of the year. While the longer-term trend remains bullish–as evidenced by price well above the upward-trending 50-day moving average, the 200-day moving average, and Ichimoku cloud–momentum indicators suggest signs of a weakening trend. The MACD is positive, though it has just crossed below its signal line. The RSI suggests bearish divergence with the peak highs in the RSI declining (while the peak highs in price have been increasing, as we would expect in a bullish trend). If the S&P breaks trendline support, look for support at the 50-day moving average (~5,055) and the 23.6% Fibonacci retracement level (5,017) that coincides with the top of the Ichimoku cloud. A resumption of the uptrend could see resistance at the 76.4% Fibonacci extension level of the previous uptrend’s price objective applied to the current uptrend. More resistance might be found at the 100% Fib extension level (~5,450).

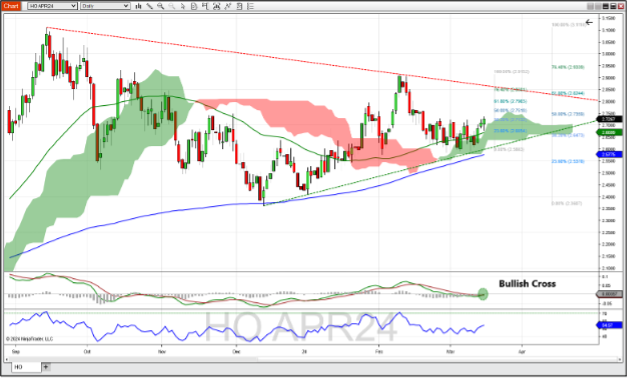
April Heating Oil Futures Daily Chart
April heating oil futures continue to trend sideways, although last week's rebound of the supportive trendline shows hope of bullishness. The week started with heating oil trading below its 50-day moving average and entering the top of the Ichimoku cloud. By the end of the week, heating oil was above both levels, suggesting a possible trend outside of the consolidation area that's been in existence since mid-February. The MACD gave a bullish indication on Friday with a cross above its signal line. A follow through might be a cross above the zero line as well. RSI is trading in line with price. Should this rally continue, resistance might be found at the 50% Fibonacci retracement level of the recent downtrend (~2.75); more resistance might be found at the 61.8% Fib level of the longer downtrend from September 2023 to December the same year (~2.82). If the trend reverses, support might be found at the supportive trend line, which is reinforced by the 200-day moving average (~2.60).

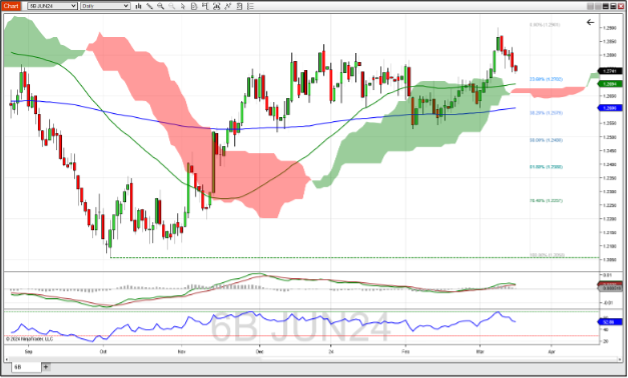
June British Pound Futures Weekly Chart
June British pound futures declined last week after making a recent high not seen since August last year. This brings the British pound back into a consolidation area that it has been trading in since the beginning of this year. While the pound is still above the 50-day moving average, the 200-day moving average and the Ichimoku cloud, the MACD and RSI are indicating that possible weakness could continue. The MACD is poised to cross below its signal line, which would be a bearish indication. It took one week for the pound to go from being briefly overbought to an almost neutral rating of 53. Should this trend continue, support might be found at the 23.6% Fibonacci retracement level, which corresponds with the 50-day moving average (~1.2700). This could be reinforced by the top of the Ichimoku cloud that's just a few ticks lower (~1.2680). A reverse to the upside could test the recent high of 1.2900.

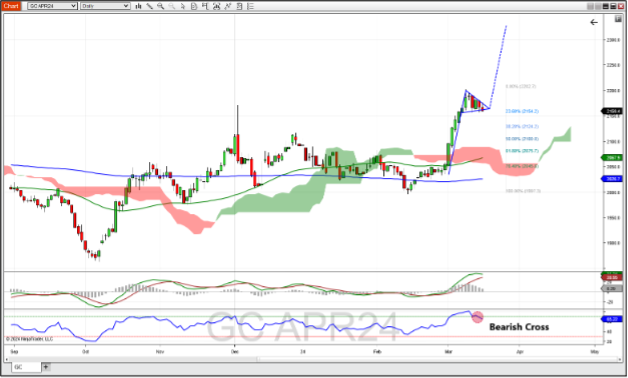
April Gold Futures Weekly Chart
April gold futures finished lower on the week, putting an end to an extremely bullish move that began in early February. The 23.6% Fibonacci retracement level acted as support and kept this market in a pennant formation. While the RSI showed some signs of bearishness as it crossed below the overbought level of 70, the MACD and its histogram are still in positive territory, and technically still in a bullish mode. The current consolidation coming off a very bullish move resembles a flag pattern that, should the market rebound, indicates a target at 2,325. If this reversal continues downward, support might be found at the 38.2% Fib level (~2,125) and further on down at the top of the Ichimoku cloud (~2055).

Economic Reports for the week of March 18 – March 22
The biggest news item this week will be the FOMC decision at 2:00 PM ET on Wednesday. The biggest question is when the Fed will cut rates, and while we know that a cut this week is probably not in the cards, clues to that answer may be found in Fed Chair Jerome Powell's press conference that comes shortly after the announcement at 2:30 PM.
The housing market gets some love this week, starting with the Housing Market Index on Monday morning. Housing Starts and Permits on Tuesday are forecast to be slightly higher than the previous month, though Thursday’s Existing Home Sales project a 2% decline from the previous month.
Thursday also sees the Philly Fed Manufacturing Index, forecast to drop from last month’s 5.2 to 0.2. Flash Manufacturing PMI is also forecast to be slightly lower at 51.9 (compared to the previous month’s 52.3). As of this writing, the only other Fed member scheduled to speak is Raphael Bostic on Friday afternoon after markets close.
| Date | Economic Reports |
|---|---|
| Monday, March 18 | 10:00 AM ET: Housing Market Index 11:00 AM ET: Export Inspections |
| Tuesday, March 19 | 8:00 AM ET: FOMC Meeting Begins 8:30 AM ET: Housing Starts and Permits 4:00 PM ET: Treasury International Capital 4:30 PM ET: API Weekly Oil Stocks |
| Wednesday, March 20 | 7:00 AM ET: MBA Mortgage Applications 10:00 AM ET: Atlanta Fed Business Inflation Expectations 10:30 AM ET: EIA Petroleum Status Report * 2:00 PM ET: FOMC Announcement * 2:30 PM ET: Fed Chair Jerome Powell Press Conference *** |
| Thursday, March 21 | 8:30 AM ET: Jobless Claims *** 8:30 AM ET: Philadelphia Fed Manufacturing Index 8:30 AM ET: Current Account 8:30 AM ET: Export Sales 9:45 AM ET: PMI Composite Flash 10:00 AM ET: Existing Home Sales 10:30 AM ET: EIA Natural Gas Report 4:30 PM ET: Fed Balance Sheet |
| Friday, March 22 | 1:00 PM ET: Baker Hughes Rig Count 3:00 PM ET: Cattle on Feed 5:00 PM ET: Atlanta Federal Reserve Bank President Raphael Bostic Speaks |
*** Market Moving Indicators
* Merit Extra Attention
Daily Futures Market Prep and Analysis With the Pros
Interact with our experts and other futures traders during daily livestreams as we analyze the markets in real time and explore our award-winning desktop platform. Log in here.
Trade Futures With Us
Sign up for your free NinjaTrader account today to start your 14-day trial of live simulated futures trading.

