Market Profile is a unique charting tool that gives traders a fresh perspective of the two-way auction process driving all market movement. It can help individual traders identify patterns in herd behavior, leading to a better understanding of overall market sentiment. It is useful in both short-term and long-term analysis.
The profile is built by plotting the volume of transactions at each price level. The result is a histogram that shows how supply and demand interact to determine the market price. It updates dynamically with price and volume data to reveal ever-changing market conditions.
Learn the importance of Market Profile in this short video:
Using Market Profile
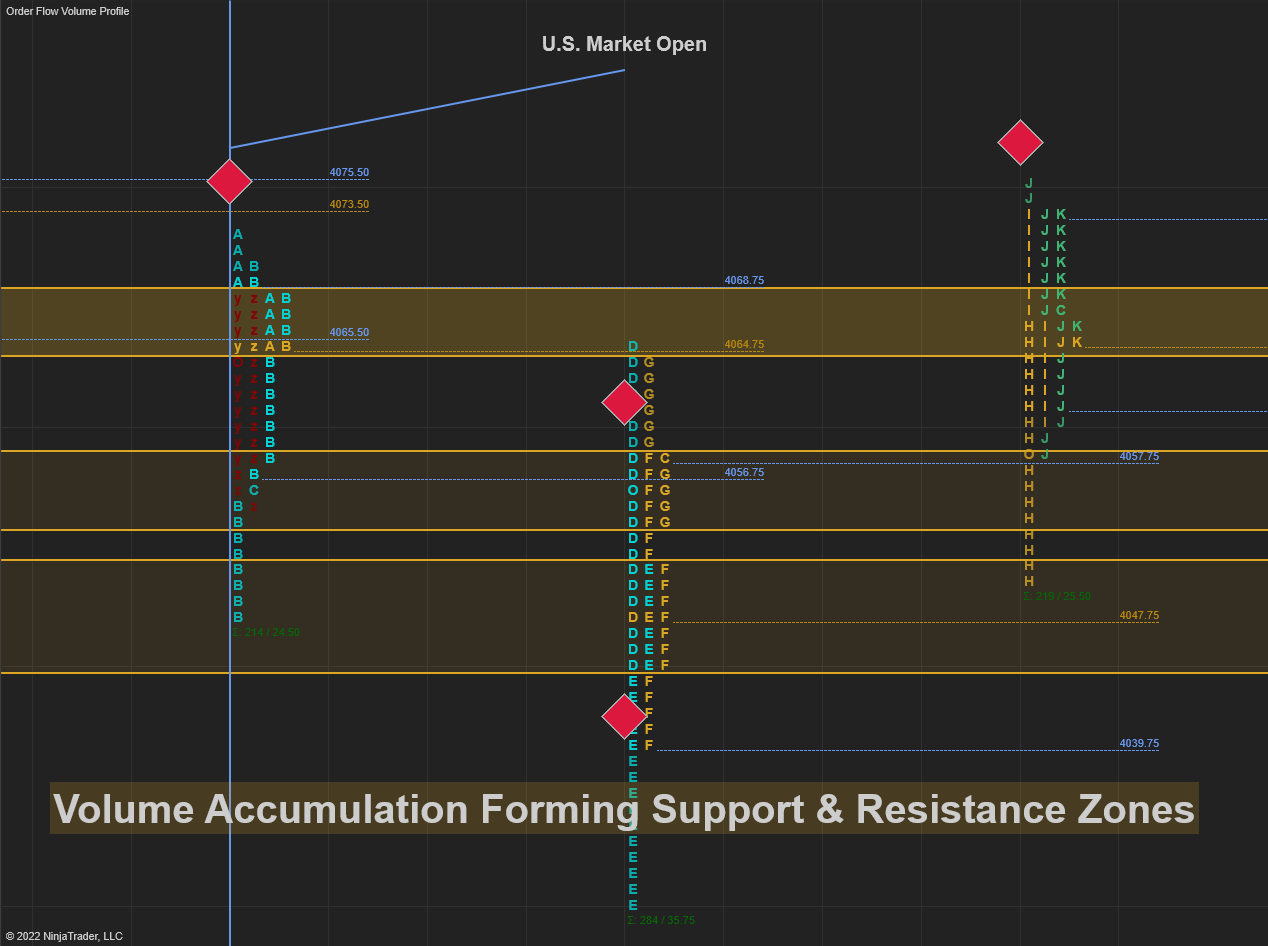
Traders often use Market Profile to identify key price levels, where there are high concentrations of transactions. These concentrations can be used as potential support and resistance levels. The profile can also be used to identify periods of high or low activity, which can help clue traders in on potential turning points in the market.

Market Profile accumulation forming support & resistance zones on a 240-minute E-mini S&P 500 chart
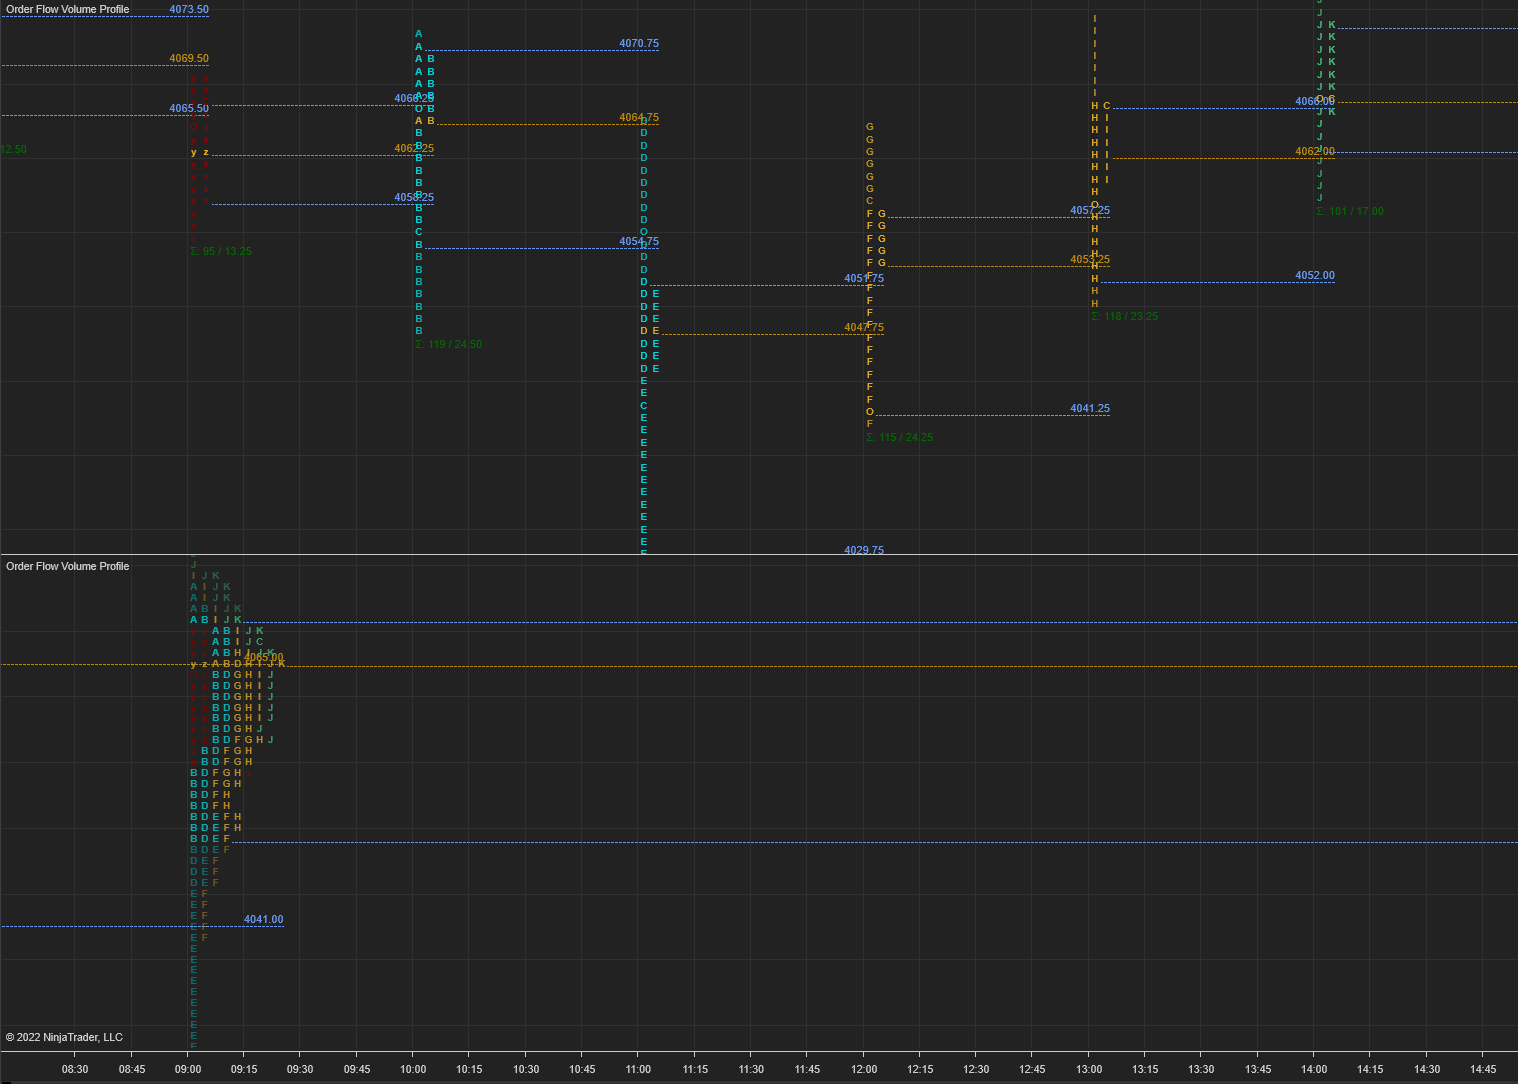
The key to Market Profile’s popularity is its versatility. It can be used in all markets and it fits well with many different trading styles. While it can be used in all time-frames, it tends to work best on longer-term charts. Longer time-frames offer more volume-at-price data, thereby revealing more concentrations and low-activity areas.

60-minute Market Profile (top) vs. 6-hour Market Profile (bottom)
Traders use Market Profile to:
- Understand what is happening in the market as it is happening.
- Identify patterns in the behavior of other market participants.Help inform better trading decisions.
Candlestick Chart vs. Market Profile
The main difference between a candlestick chart and Market Profile™ is that a candlestick chart only shows the price action, while Market Profile™ shows both the price action and the order flow. Order flow is the net sum of all the buy and sell orders in the market.
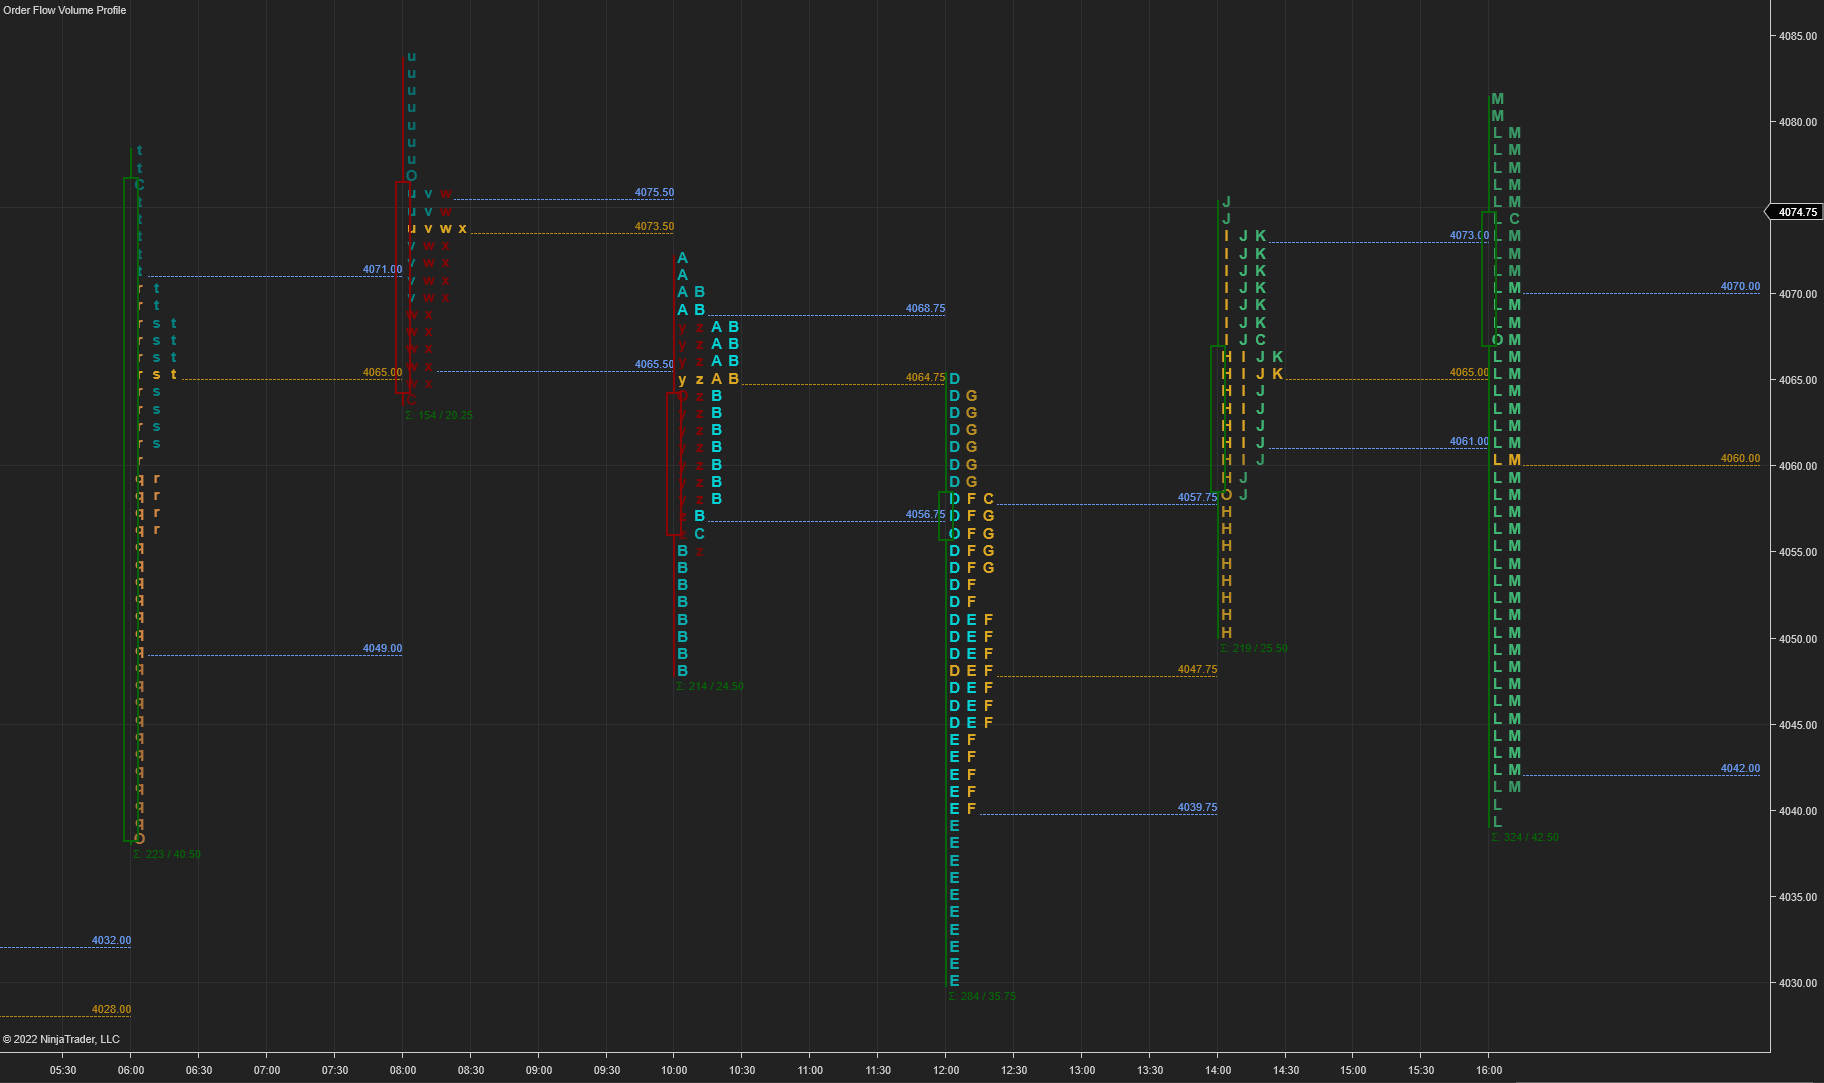
This added dimension is also commonly referred to as “TPO”, or Time Price Opportunity. Each TPO has three components: a time value, a price value, and volume. The time-value of a TPO is the amount of time that the market spends trading at a certain price. The price-value is the price at which the market is trading. In other words, the time-value is the amount of time that the market is “willing” to spend trading at a certain price, while the price-value is the price that the market is “willing” to trade at. Lastly, volume represents success of the TPO.

120-minute Market Profile with hollow candlesticks overlaid. Much more information about market participation can be drawn from the Market Profile.
Letters and Colors Decoded
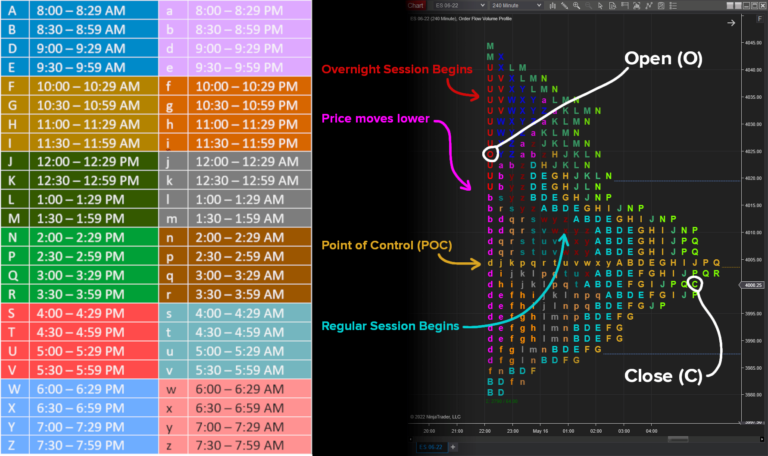
By now, you’re probably wondering what all of these letters mean. The letters on the Market Profile represent specific time windows. Capital A-Z correspond to half-hour increments starting at 8AM and ending at 8PM US Central Time. Conversely, the lower-case a-z represent the overnight trading session – 8PM to 8AM. This is helpful when looking at a larger time-frame Market Profile™ histogram, such as a full day. Here is a quick reference table for the various letters.
 Notice that both “O” and “C” are omitted from the letters used. These special characters are reserved for the opening and closing of the time period. Notice also how trade volume moves across several price areas over time in the full session example shown above.
Add Market Profile to Your Trading
Market Profile is not a Holy Grail, and it is not a silver bullet. It is, however, a powerful tool that can help traders make better decisions. It can be a great complement to other tools and techniques you may already be using, so try adding Market Profile to your existing trading setup and see if it can help you make more informed trading decisions.
A whole suite of Volume Profile tools is included with the NinjaTrader platform’s Order Flow features. To add these letters to any chart within NinjaTrader:
- Right click on the chart window and select Indicators
- Locate Order Flow Volume Profile from the top left list and double click on it
- Set Profile type to Price & Draw mode to Letters
- Choose a reasonable Ticks per level value, such as 4 for the E-mini S&P 500
- Set Profile period to Bars & the Bars value below as desired
- A reasonable starting point is a 30 or 60-minute chart with Bars values ranging from 1 to 6
- Any traders choose to select the Hide bars option under Visual
Get Started with NinjaTrader
NinjaTrader supports more than 500,000 traders worldwide with a powerful and user-friendly trading platform, discount futures brokerage and world-class support. NinjaTrader is always free to use for advanced charting & strategy backtesting through an immersive trading simulator.
Download NinjaTrader’s award-winning trading platform and get started with a free trading demo with real-time market data today!

