In this week’s coverage, we analyze the various stages of downtrends in the E-mini S&P 500, heating oil, British pound and Micro Bitcoin futures. We also examine the economic reports and earnings announcements expected next week.
Commentary and charts reflect data at the time of writing. Market conditions are subject to change and may not reflect all market activity.
June E-mini S&P 500 Index Futures Weekly Chart
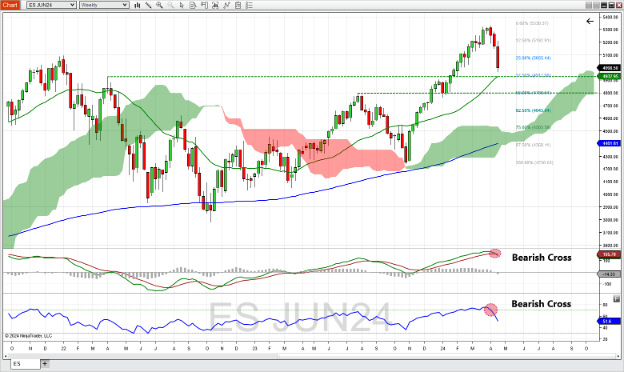
June E-mini S&P 500 Index futures experienced the biggest down week since September 2022, closing above the 38.2% Fibonacci retracement of the previous uptrend that began in October last year. This Fibonacci level coincides with the 26-week moving average and a previous peak high from April 2022. Price remains above the 200-week moving average and the Ichimoku cloud, which is considered bullish. This breakdown in price caused the MACD to cross below its signal line, which indicates that momentum is changing to the downside. The RSI had also showed a bearish indication when it broke below the overbought level of 70 – and quickly continued the trend with a reading of 51+ last week. Should this downtrend continue, look for support at the 38.2% Fib level (4,910) and further down at the 50% Fib level, which corresponds to a previous peak high in August of last year (~4,790). A reversal to the bullish side may see resistance at the 23.6% Fib level (~5,070).
 June E-mini S&P 500 Index futures chart
June Heating Oil Futures Weekly Chart
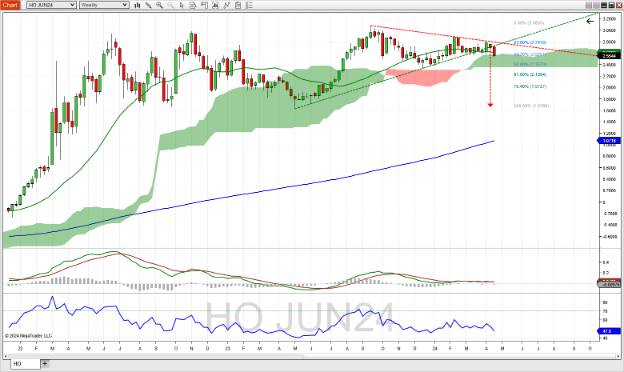
June heating oil futures finished the week down as Friday's close pushed heating oil futures below the 26-week moving average and into the Ichimoku cloud. This also put heating oil just below the 38% Fibonacci retracement level of the bullish trend, measured from May to September last year. This also broke heating oil out of an ascending triangle pattern, which implies a target of ~1.6500. Note that there is no expectation of when or if this target will be achieved. The MACD has been sideways and tangled up with its signal line since February, which indicates a consolidating market. The RSI has been reflecting price action all year as well. Should this downtrend continue, support might be found at the 50% fib level, which coincides with the bottom of the Ichimoku cloud (~2.3570). Further support might be found at the 61.8% Fib level (~2.1850). A rally back up might find resistance at the 23.6% fib level (~2.7400).
 June heating oil futures chart
June British Pound Futures Weekly Chart
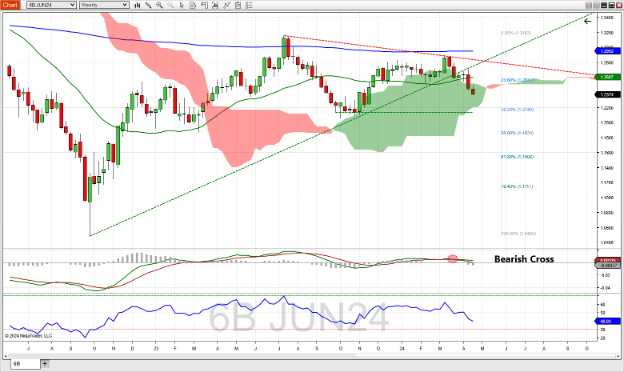
June British pound futures continued to slide as last week marked a complete candle in the Ichimoku cloud. This continues the bearish pattern of behavior that the British pound has exhibited in the last month or so. A breakdown out of an ascending triangle implies a target of 1.1060–note that there is no time limit to achieve this level if it does at all. A cross below the 26-week moving average into the Ichimoku cloud preceded last week's activity. The MACD showed a bearish cross about mid-March and the RSI is trending down in price. Should this trend continue, support might be found at the 38.2% Fibonacci retracement level of the uptrend that began in October 2022 and completed in June last year (1.2140). This level also coincides with the support level that was tested last fall. A rally out of the Ichimoku cloud might find resistance at the 23.6% Fib level (~1.2530).
 June British pound futures chart
April Micro Bitcoin Futures Weekly Chart
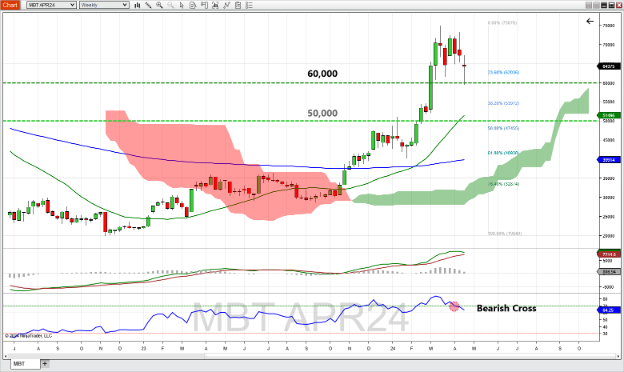
April Micro Bitcoin futures tested the psychological level of 60,000 before rallying almost to where it opened the week, closing slightly down about 0.5%. Last week's trading range showed modest volatility, representing about 10% of Bitcoin’s price. Bitcoin remains above its 26-week and 200-week moving average as well as the Ichimoku cloud. While the MACD remains positive, it's poised to cross below its signal line, which could indicate that this recent downtrend has a little more longevity. RSI showed a bearish cross at the beginning of April and price seems to be following through. Should this downtrend continue, support may occur at the 60,000 level, and further down at the 38.2 Fibonacci retracement level (~54,000). A rally might see some resistance at the recent highs near 75,000.
 April Micro Bitcoin futures chart
Companies Reporting Earnings April 22 – April 26
With almost one third of the Dow Jones index companies reporting next week, YM and MYM futures may experience some volatility both before and after markets every day this week.
The tech sector is represented by Meta (formerly Facebook) Wednesday afternoon, and with Microsoft, Google, and Intel reporting Thursday afternoon, this could affect trading in S&P 500 and Nasdaq futures.
Other sectors represented this week are the oil sector with ExxonMobil, Hess Energy, Chevron, and Valero reporting; the airline sector with American, JetBlue, and Southwest reporting; and the communications sector, represented by T-Mobile, Verizon, and AT&T.
Other notables are Tesla reporting aftermarkets Tuesday and Boeing reporting before market open on Wednesday, as both companies have experienced their share of bad news recently.
| Date | Companies Earnings |
|---|---|
| Monday, April 22 | Verizon Communications (VZ): $1.12 EPS Estimate, $33.38B Revenue Estimate (BMO) * |
| Tuesday, April 23 | General Motors Corp. (GM): $2.06 EPS Estimate, $40.61B Revenue Estimate (BMO) United Parcel Service, Inc. (UPS): $1.33 EPS Estimate, $21.96B Revenue Estimate (BMO) General Electric Co. (GE): $0.69 EPS Estimate, $13.80B Revenue Estimate (BMO) PepsiCo, Inc. (PEP): $1.52 EPS Estimate, $18.16B Revenue Estimate (BMO) Lockheed Martin Corp. (LMT): $5.80 EPS Estimate, $16.05B Revenue Estimate (BMO) JetBlue Airways Corporation (JBLU): $-0.53 EPS Estimate, $2.21B Revenue Estimate (BMO) Tesla (TSLA): $0.49 EPS Estimate, $22.71B Revenue Estimate (AMC) Visa Inc (V): $2.43 EPS Estimate, $8.60B Revenue Estimate (AMC) * |
| Wednesday, April 24 | Boeing Co. (BA): $-1.38 EPS Estimate, $16.95B Revenue Estimate (BMO) * AT&T Corp. (T): $0.53 EPS Estimate, $30.54B Revenue Estimate (BMO) Humana, Inc. (HUM): $6.02 EPS Estimate, $28.47B Revenue Estimate (BMO) Meta Platforms, Inc. (META): $4.32 EPS Estimate, $36.15B Revenue Estimate (AMC) International Business Machines Corp. (IBM): $1.59 EPS Estimate, $14.56B Revenue Estimate (AMC) * Ford Motor Company (F): $0.42 EPS Estimate, $40.64B Revenue Estimate (AMC) |
| Thursday, April 25 | American Airlines Group Inc. (AAL): $-0.28 EPS Estimate, $12.60B Revenue Estimate (BMO) Caterpillar, Inc. (CAT): $5.12 EPS Estimate, $15.99B Revenue Estimate (BMO) * Southwest Airlines Co. (LUV): $3.88 EPS Estimate, $6.46B Revenue Estimate (BMO) Valero Energy Corp. (VLO): $2.01 EPS Estimate, $32.38B Revenue Estimate (BMO) Merck & Co., Inc. (MRK): $-0.31 EPS Estimate, $15.33B Revenue Estimate (BMO) * Dow Chemical Co. (DOW): $0.47 EPS Estimate, $10.70B Revenue Estimate (BMO) * Hess Corp (HES): $1.74 EPS Estimate, $2.86B Revenue Estimate (BMO) Microsoft Corp. (MSFT): $2.81 EPS Estimate, $60.77B Revenue Estimate (AMC) * Alphabet Inc. (GOOGL): $1.49 EPS Estimate, $78.61B Revenue Estimate (AMC) Intel Corp. (INTC): $0.11 EPS Estimate, $12.77B Revenue Estimate (AMC) * T-Mobile US Inc. (TMUS): $1.89 EPS Estimate, $19.69B Revenue Estimate (AMC) |
| Friday, April 26 | Exxon Mobil Corp. (XOM): $2.19 EPS Estimate, $83.47B Revenue Estimate (BMO) Chevron Corporation (CVX): $2.89 EPS Estimate, $51.17B Revenue Estimate (BMO) * Colgate-Palmolive Co. (CL): $0.82 EPS Estimate, $4.95B Revenue Estimate (BMO) |
* indicates that this company is in the Dow Jones Index
Economic Reports for the week of April 22 – April 26
If the calendar seems a little light this week, it's partially due to the quiet period that the Fed speakers are subject to before the next FOMC meeting. The week starts with the Chicago Fed’s National Activity Index and starts to ramp up on Tuesday with PMI Manufacturing and Services, New Home Sales, and the Richmond Fed Manufacturing Index in the morning.
Later that afternoon, the Money Supply report arrives, which can help us understand inflationary pressures. Aside from the regular weekly reports, Wednesday morning sees Durable Goods Orders, but the big reports come on Thursday and Friday.
In addition to the usual Jobless Claims, GDP for Q1 2024 lands at 8:30 AM ET Thursday morning. The Kansas City Fed reports their Manufacturing Index later that morning. Friday morning we see Personal Income and Outlays, which the Fed follows closely. University of Michigan’s Consumer Sentiment reports arrives 10:00 AM Friday.
| Date | Economic Reports |
|---|---|
| Monday, April 22 | 8:30 AM ET: Chicago Fed National Activity Index 11:00 AM ET: Export Inspections 11:30 AM ET: 3-Month Bill Auction 11:30 AM ET: 6-Month Bill Auction 4:00 PM ET: Crop Progress |
| Tuesday, April 23 | 8:30 AM ET: Housing Starts and Permits 9:00 AM ET: Federal Reserve Vice Chair Philip Jefferson Speaks 9:15 AM ET: Industrial Production 4:30 PM ET: API Weekly Oil Stocks 9:45 AM ET: PMI Composite Flash 10:00 AM ET: New Home Sales 10:00 AM ET: Richmond Fed Manufacturing Index 1:00 PM ET: Money Supply 1:00 PM ET: 2-Year Note Auction 4:30 PM ET: API Weekly Oil Stocks |
| Wednesday, April 24 | 7:00 AM ET: MBA Mortgage Applications 8:30 AM ET: Durable Goods Orders 10:30 AM ET: EIA Petroleum Status Report 11:00 AM ET: Survey of Business Uncertainty 11:30 AM ET: 4-Month Bill Auction 11:30 AM ET: 2-Year FRN Auction 1:00 PM ET: 5-Year Note Auction 3:00 PM ET: Cold Storage |
| Thursday, April 25 | 8:30 AM ET: Jobless Claims 8:30 AM ET: GDP 8:30 AM ET: Wholesale Inventories (Advance) 8:30 AM ET: Retail Inventories (Advance) 8:30 AM ET: International Trade in Goods and Services 8:30 AM ET: Export Sales 10:00 AM ET: Pending Home Sales Index 10:30 AM ET: EIA Natural Gas Report 11:00 AM ET: Kansas City Fed Manufacturing Index 11:30 AM ET: 4-Week Bill Auction 11:30 AM ET: 8-Week Bill Auction 1:00 PM ET: 7-Year Note Auction 4:30 PM ET: Fed Balance Sheet |
| Friday, April 26 | 8:30 AM ET: Personal Income and Outlays 10:00 AM ET: Consumer Sentiment 1:00 PM ET: Baker Hughes Rig Count |
*** Market Moving Indicators
* Merit Extra Attention
Daily Futures Market Prep and Analysis With the Pros
Interact with our experts and other futures traders during daily livestreams as we analyze the markets in real time and explore our award-winning desktop platform. Log in here.
Trade Futures With Us
Sign up for your free NinjaTrader account today to start your 14-day trial of live simulated futures trading.

