The Commodity Channel Index (CCI) is a versatile technical analysis tool used by traders to help assess potential trend reversals and momentum shifts. Originally designed for commodities, this oscillator is a favorite for futures traders looking to enhance their chart analysis.
Whether you're new to the CCI or exploring ways to use it more effectively, understanding how it works can help you better interpret market behavior.
What is the Commodity Channel Index?
The CCI is a momentum oscillator that was created by Donald Lambert in 1980. Originally designed for analyzing commodity prices, it’s now widely used across various futures markets—including stock index, currency, and bond futures. The CCI helps traders assess how far current prices deviate from their average, highlighting potential overbought or oversold conditions.
How the CCI is calculated
The CCI is built around the concept of the typical price—an average of a bar’s high, low, and close. To calculate the CCI, this typical price is compared to its moving average over a selected number of periods, often 14. The difference between the two is then scaled using a constant factor, resulting in the final CCI value.
The resulting number is not bound between fixed values, unlike other indicators such as the RSI (relative strength index). This unbounded range allows the CCI to reflect different levels of momentum across various markets, but it also means that what is considered “overbought” or “oversold” can vary depending on the asset.
Reading the CCI on a chart
Typically plotted below a price chart, the CCI oscillates above and below a zero line. Traders often draw horizontal lines at +100 and -100 to serve as preliminary markers for potential overbought and oversold conditions. However, the effectiveness of these thresholds can vary by market.
For example, while a +100 reading might indicate overbought conditions in E-mini S&P 500 (ES) futures, it could take a +200 level or more to suggest the same in Nasdaq (NQ) futures. The same variability applies to oversold conditions, which are often marked at -100 or lower.
Using the CCI to identify trend changes
Beyond spotting overbought and oversold levels, the Commodity Channel Index can be helpful in identifying divergences—when price trends and indicator trends move in opposite directions. For instance, if a futures market is making higher highs while the CCI is making lower highs, it may suggest weakening momentum and a potential reversal. Divergence is especially useful when combined with other forms of analysis or confirmation signals. While the CCI can help highlight possible shifts, it's not intended to be used in isolation.
Customizing CCI levels for your market
Because the CCI is unbounded, it’s important to experiment with thresholds that suit the futures contract you're trading. Review historical data to observe where the CCI has previously aligned with key turning points in price. This can help you set more effective overbought and oversold levels.
For example:
- On a 10-minute chart of ES futures, +200 might consistently mark short-term peaks.
- For natural gas (NG) futures, a -100 level could often correspond to rebound points due to different volatility dynamics.
Enhancing signals with time frame analysis
The CCI can be used across multiple time frames—from intraday to weekly charts. A common approach is to align short-term CCI signals with longer-term trend context. For example, if a daily chart shows an uptrend and the 10-minute chart’s CCI falls below -200 and begins to recover, it may support a case for a short-term entry in the direction of the broader trend.
Entry and exit strategies with the CCI
Some traders look for the Commodity Channel Index to cross back into the neutral zone (between -100 and +100) from extreme levels as a potential entry signal. Exits may be timed based on returning to neutrality, hitting a predetermined profit target, or when another indicator signals a trend exhaustion.
While the CCI alone doesn’t guarantee predictive accuracy, pairing it with tools like Bollinger Bands, RSI, and price patterns can help increase confidence in trade decisions.
Learn more about mastering entry and exit strategies in futures trading.
Taking a closer look at CCI divergences
In strong trends, the CCI may offer early warnings of momentum shifts through divergences. In an uptrend, if the price continues to rise but the CCI forms lower highs, it can indicate weakening strength behind the move. This may signal a forthcoming pullback or trend reversal. Similarly, in a downtrend, rising CCI troughs against falling prices may suggest building upward pressure.
Why the CCI matters for futures traders
For active futures traders, understanding market momentum is crucial. The CCI provides a flexible, market-agnostic way to assess potential turning points and momentum shifts. Whether you're trading indices like the E-mini S&P 500, commodities like natural gas, or other futures contracts, the CCI can be an important tool in your technical toolkit.
Putting it into practice
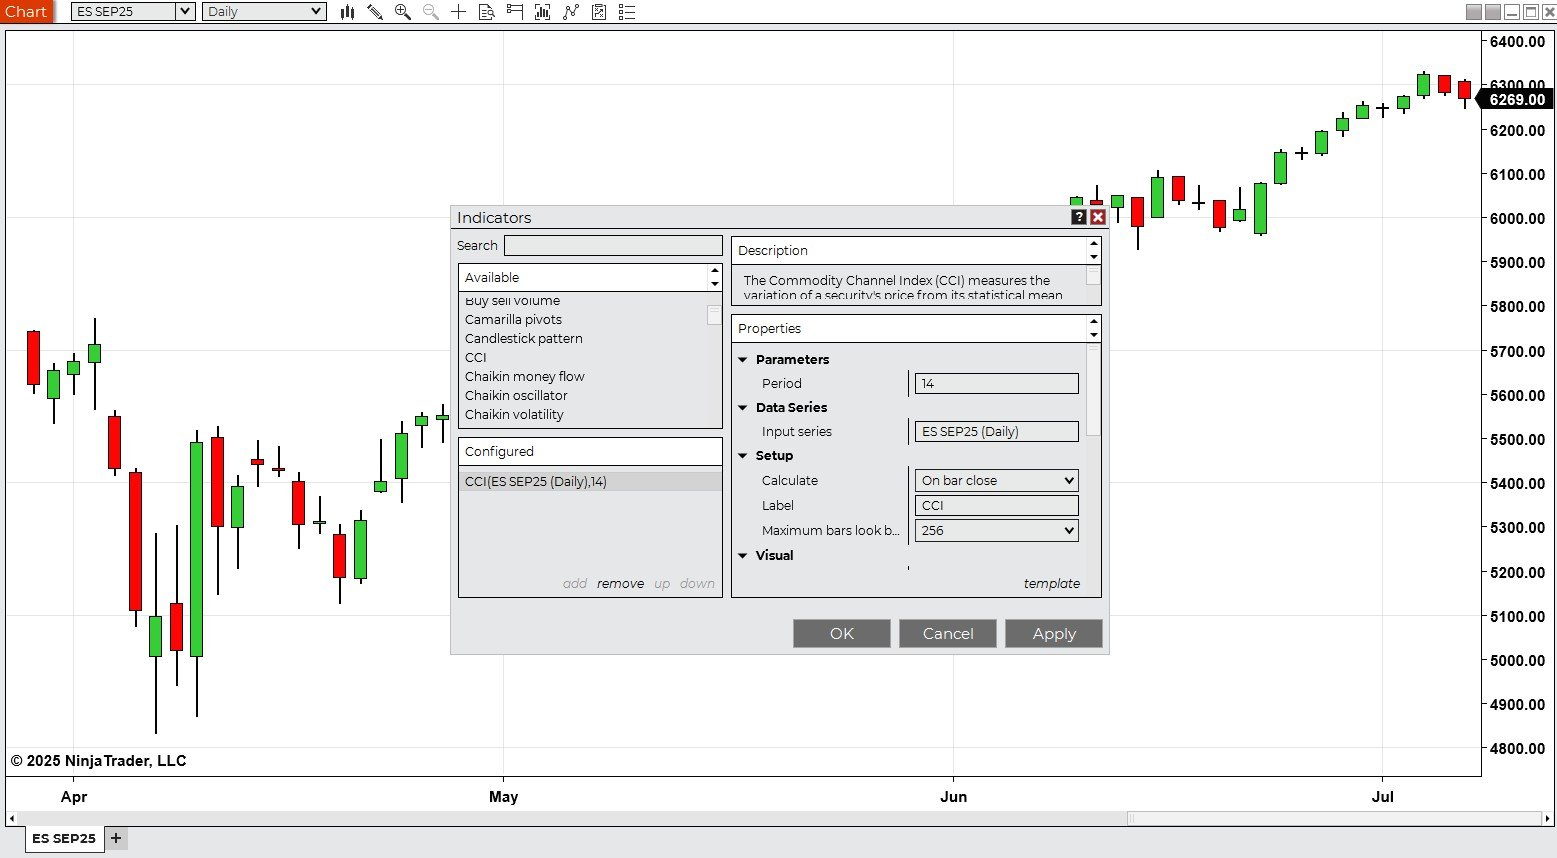 Accessing the CCI indicator on the NinjaTrader Platform
To get started with the CCI on the NinjaTrader platform:
- Open a chart of your preferred futures market.
- Right-click, select “Indicators,” and choose “CCI” to add it to your chart.
- Customize the period and visual settings as needed.
- Add horizontal lines at threshold levels that reflect overbought and oversold conditions for your market.
Get valuable insights from your chart analysis
Understanding how to interpret the CCI can help you make more informed trading decisions. Experiment with it across different time frames and markets and consider how it aligns with other tools in your strategy. Used thoughtfully, the Commodity Channel Index can offer valuable insights into price behavior and momentum in futures markets.

Trade Futures with NinjaTrader
Haven't signed up for your free NinjaTrader account yet? Get started today with a 14-day trial of live simulated futures trading.
