Day trading futures can be a rewarding and exhilarating experience that often requires split-second decision making. Having the right technical analysis tools in your arsenal can help you instantly spot day trading opportunities as they develop. But with so many indicators to choose from, what are the essential tools you need on your charts? In futures trading, it’s always a good idea to follow the pros, so in this article we will look at the five essential trading indicators that are widely used by futures day traders today.
Day traders need to be keenly aware of the dynamic, ever-shifting forces in the market. It’s important to be able to identify directional price trends as well as key support and resistance levels throughout the day in order to quickly determine order prices.
Here Are Five Essential Indicators For Day Trading Futures
1. Pivots
Pivots are a widely used indicator and were frequently used as a day trading indicator on the trading floors of exchanges. Often referred to as ‘Floor Trader Pivots’, this tool is easy to calculate and remains one of the most widely used day-trading tools for futures traders today. The pivot calculation produces seven support and resistance levels that are calculated using the previous trading day’s high, low and close values, for use as potential entries, profit targets, or stop losses. Pivots are generally used on intraday charts and provide fixed trading levels throughout the trading session.
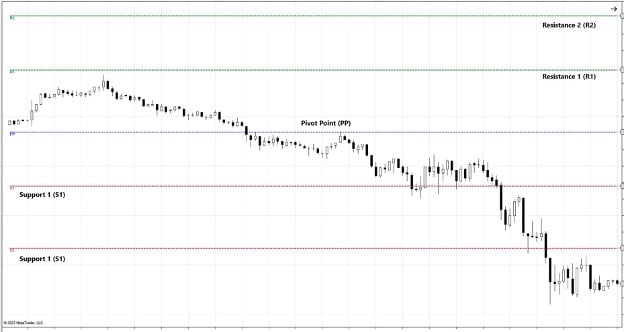
The center Pivot Point (PP) is the average of the previous day’s high, low and can be used to help determine directional bias (is the current price above or below the pivot?) as well as used as a key support and/or resistance level. Three resistance levels are drawn above the Pivot Point (PP) and are labelled R1, R2 and R3. Three support levels are drawn below the Pivot Point (PP) labelled S1, S2 and S3. Each pivot level can be used as either support or resistance depending on where price is trending in proximity to each level. The Pivots indicator is included out of the box with the NinjaTrader Desktop platform along with 100+ technical indicators.
Since this is a popular trading indicator with futures day traders, these pivot levels can attract higher levels of orders, which might appear on a chart as consolidation with prices stalling at these levels until a new trend direction is established. On trendy days where news moves the market suddenly, these levels can act as strong support and resistance levels as prices break up or down sharply to one or more of these pivot levels then pause or reverse. Prices quickly moving through a pivot may indicate a strong directional bias.
2. Previous OHLC (Open, High, Low, Close)
Ask any trader and they will say that the most important price values on a bar are the high, low and close. The high and low represent where the market found trading boundaries for that period, and the close is where the market agreed on a final/fair price for that period. When looking at a daily bar, these prices can represent significant support and resistance levels for the next trading day.
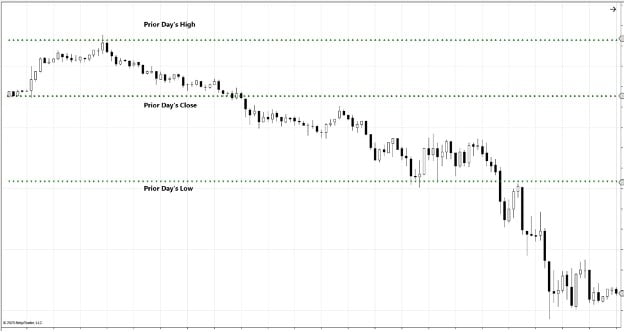
When day trading futures, charting the previous day’s High, Low, and Close on an intraday chart can help to show where price may find support or resistance. Often these values will align with other support and resistance levels indicators you may be tracking. When this happens, the support and resistance levels are generally considered even stronger.
Applying the ‘PriorDayOHLC’ indicator to an intra-day chart allows you to select some or all of those levels that are key to your trading, e.g. Open, High, Low, or Close. The NinjaTrader Desktop platform allows you to customize the formatting to make the levels easy to identify.
3. Opening Range
While the four major market indices including Micro Emini futures trade continuously for 23 hours a day, the largest day trading futures volume tends to come in at the traditional regular session floor open at 9:30a.m. ET. This heavy large volume continues for some number a minutes after the open often creating higher volatility and establishing the initial high and low of the day. This behavior can be seen in many other financial and commodity futures as well.
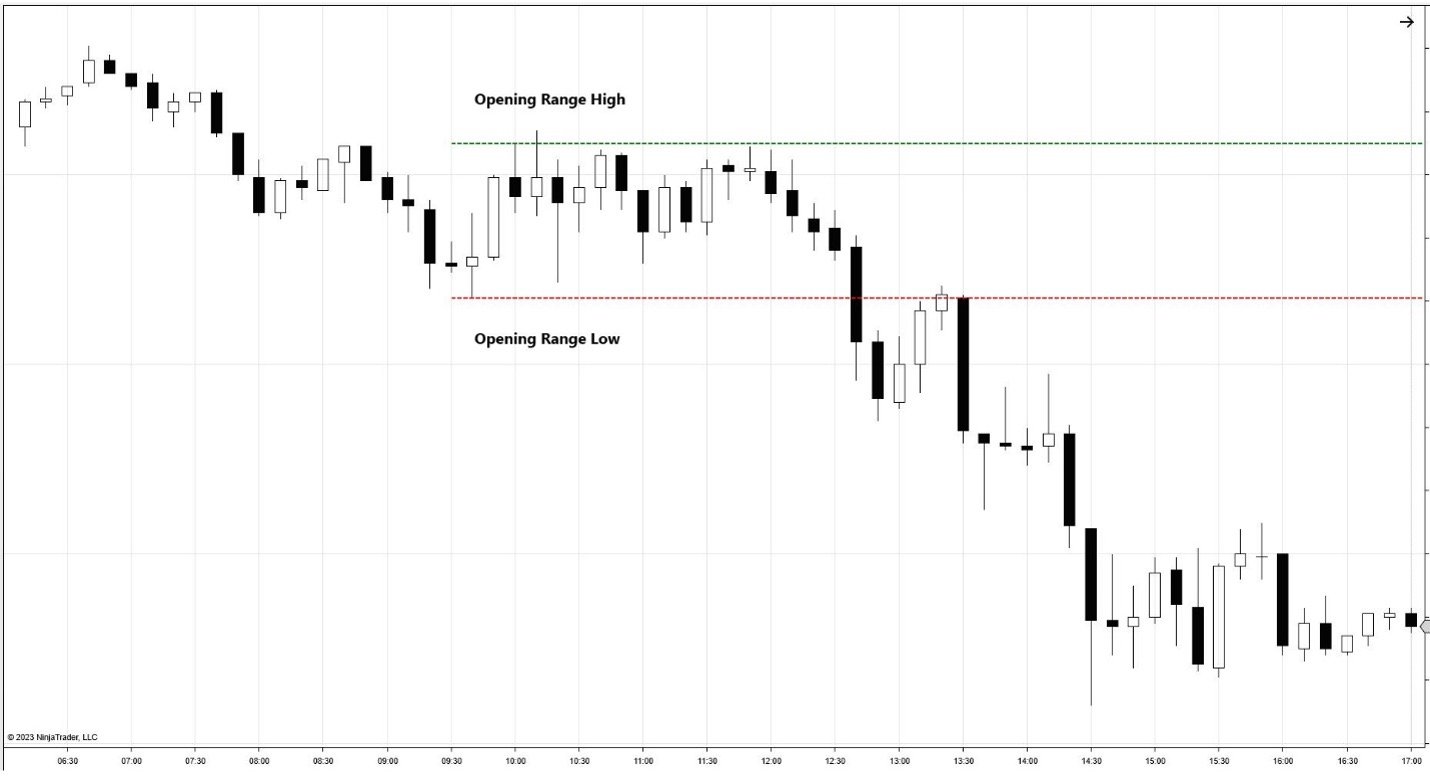
The highs and lows established during this opening range are important as they can be used as key support and resistance levels throughout the rest of the day. The opening range duration is variable, and set by the trader, setting a 30, 45, or 60 minute time window is common practice for most futures day traders. It is interesting to note here that often either the high or low set in this opening range ends up being the high or low for the entire day.
Breaking out of the set high or low of the opening range period can provide guidance for how the day’s directional bias might set up. If price breaks above the opening range high, then it is less likely (though not impossible) that the market will trade down and below the opening range low (and vice versa). Opening range breakouts can be opportunities to catch a big intraday move, make sure to have a stop loss or trailing stop in place to manage risk.
4. Order Flow VWAP
Volume-Weighted Average Price (VWAP) is a more sophisticated way to analyze price action than a simple mathematical average of price. The VWAP calculation gives more weight for trades with large volume. The indicator plots a line on the chart at the average price paid for all contracts since a set starting time, usually the beginning of the trading session, although for stock indices, you may want to alter this start time to the beginning of the regular day trading session.
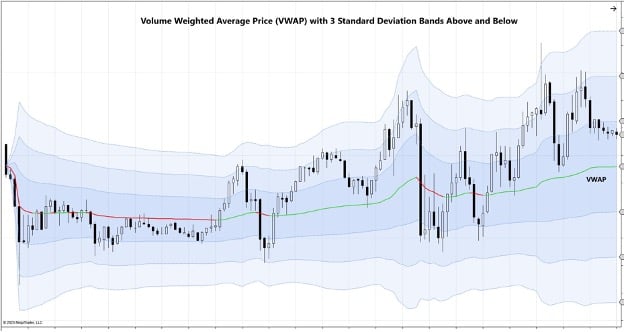
Professional futures day traders often use VWAP to measure their efficiency in entering and exiting trades, generally trying to buy below VWAP and selling above. You can see this behavior in a chart as prices get stretched too far the market will often retrace back toward VWAP. The slope of VWAP and proximity of the current price to VWAP can help shape a trader’s directional bias – when price is trading below VWAP, that is generally a bearish state – likewise, when price is above VWAP, the market is thought to be bullish.
The NinjaTrader Desktop platform includes a premium add-on order flow feature set with a customizable VWAP indicator. This dynamic day trading tool allows for the additional plotting of standard deviation bands above and below the VWAP. Each of these levels can act as dynamic support and resistance levels when day trading futures, when volume really heats up based on news or the start of the regular trading hours, the VWAP and subsequent bands can turn dramatically.
5. Order Flow Volume Profile
Volume profile is another essential indicator for futures day trading as it incorporates three key aspects of the trading activity throughout the day. The point of control (POC) is the price where the most volume has occurred so far during the session. The trading profile shows the other prices where trading was heavy or consolidated. And the value area is the price range one standard deviation above and below the point of control.
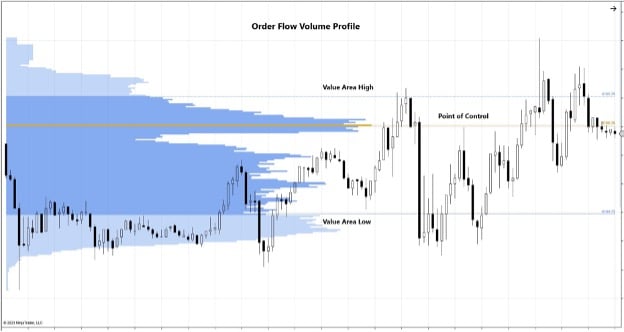
The volume profile indicator displays as a histogram along the Y-axis price scale, measuring the number of contracts trading at a specified price, to help determine which price ranges could be important support and resistance trading levels. The volume profile histogram makes it very easy to see where volume was heaviest and where there was less volume.
Futures day traders often consider the point of control a key level, acting like a magnet attracting prices. Other volume / price spikes on the histogram can be used to help set profit targets or stop loss levels as buyers and sellers generally “agree” at these levels. The value area is another set of support and resistance levels that can help determine if the current price is stretched too far from the point of control.
Use Indicators And Tools In Combination When Developing A Futures Day Trading Strategy
This list by no means comprises the only tools a futures day trader should employ. Other technical indicators and tools used in combination can be invaluable when customizing a day trading strategy. Additional options for futures day traders include incorporating multi-time-frame analysis and, monitoring various bar intervals to visualize a comprehensive picture of the markets they are trading.
In addition, futures markets can be driven by several external factors, including news, government reports and other economic influences. Effective futures day trading requires a combination of technical and fundamental analysis, risk management, and the discipline to follow a tested trading plan.
Ready for More?
We have created a free multi-video trading course called, “Develop the Trader in You” to help you build familiarity with the futures trading basics. Watch part 1 to get started on your path to learning how to trade futures.
Also be sure to join our daily livestream events as we prepare, analyze, and trade the futures markets in real-time.
Get Started with NinjaTrader
NinjaTrader supports more than 800,000 traders worldwide with a powerful and user-friendly trading platform, discount futures brokerage and world-class support. NinjaTrader is always free to use for advanced charting and strategy backtesting through an immersive trading simulator.
Download NinjaTrader’s award-winning trading platform and get started with a free trading demo with real-time market data today!

