Trade Futures with the #1 Futures Broker
NinjaTrader provides affordable access to the futures markets for traders. Trade futures with $50 day trading margins and low commissions through our futures brokerage services.
Open Account
What is a futures broker?
A futures broker is a registered firm that gives traders direct access to futures markets—placing orders on regulated exchanges, holding margin and customer funds in segregated accounts, and clearing trades. In the U.S., futures brokers must register with the Commodity Futures Trading Commission (CFTC) as futures commission merchants (FCMs) and be Members of the National Futures Association (NFA). NinjaTrader Clearing, LLC is a CFTC-registered FCM and NFA Member (NFA ID: 0309379), serving active futures traders with $50 day trading margins on Micro E-mini contracts, commissions as low as $0.09 per side, and direct access to CME Group, Eurex, ICE, and Coinbase Derivatives.
What makes NinjaTrader a top-rated futures broker?

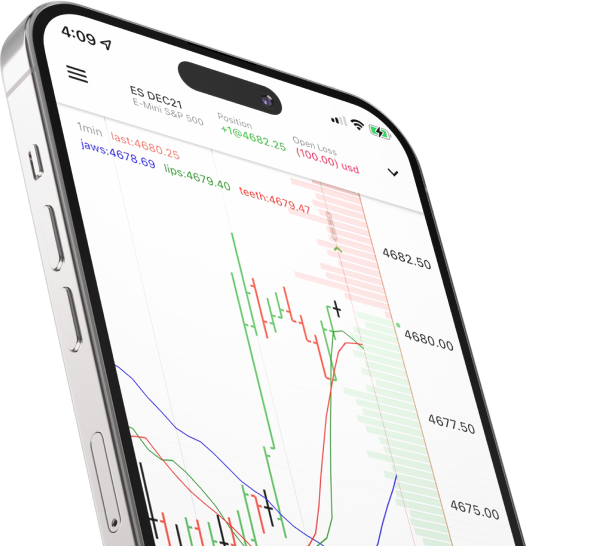
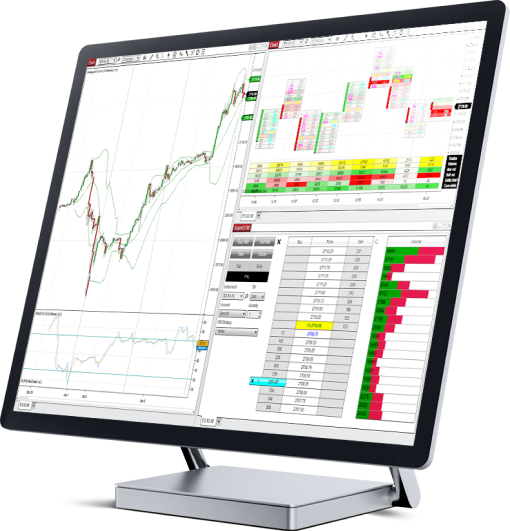
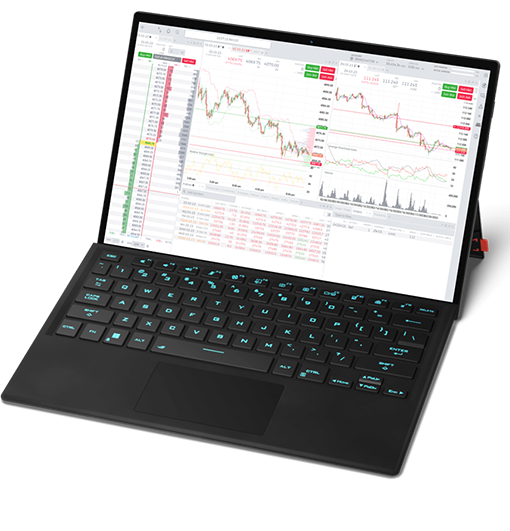
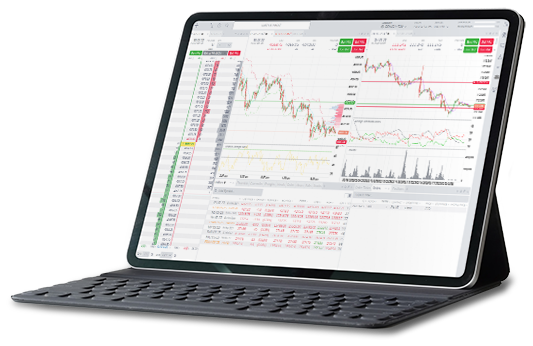
Free award-winning platforms
Trade with integrated desktop, web and mobile platforms

Low day trading margins
$50 margins for Micros and $500 for E-Minis

No deposit minimum* and flexible funding
Multiple ways to fund your account, including ACH
*ACH and debit card transfers are subject to a $5.00 minimum.

Discount pricing
Save on trades with commissions as low as $.09 per contract
NinjaTrader was recognized as the "Best Futures Broker" by BrokerChooser for 2025 and 2026 and "Best Broker for Trading Micro Gold (MGC) Futures" for 2026. BrokerChooser determines the ratings based on evaluation and real-account testing of brokers and investment platforms. NinjaTrader has a paid marketing relationship with BrokerChooser, but paid no application fee to earn this rating or otherwise participate in BrokerChooser's independent methodology.

Powerful tools for new and active futures traders
As the leading futures broker, NinjaTrader offers a wide array of additional tools and services to support your futures trading:
- Unlimited simulated futures trading
- Unfiltered professional market data
- Extensive historical tick, min, and daily data
- Free 24-hour emergency trade desk
- Award-winning charting and analysis tools
- Unlimited support and daily training
See why more traders are choosing futures
More day traders continue to transition into the highly liquid futures markets.
Trade the same markets as wall street with a lower initial investment.
*ACH and debit card transfers are subject to a $5.00 minimum.
Control a higher contract value with less capital through leverage*
Futures contracts provide significantly more buying power than stocks, enabling you to control large contract values with a smaller amount of capital.
* Leverage also increases the risk associated with futures trading, and only risk capital should be used to trade.
Short sell without restriction


Trade 100+ futures contracts with NinjaTrader’s brokerage
Gain exposure, manage risk, and expand your trading portfolio to capitalize on the most liquid markets around the world, supported by NinjaTrader’s futures brokerage.
Track, test, and explore the markets, with more than 100 futures contracts available to trade—indexes, currencies, metals, interest rates, and more.
Best brokerage for trading futures

NinjaTrader is recognized for its unique combination of a high-performance trading platform, discount pricing, and real-time support.
Download NinjaTrader's award-winning software for FREE and see why it's consistently voted an industry leader by the trading community. NinjaTrader is always free for advanced charting, backtesting, and trade simulation.
Recognition
-

2026 Best Futures Broker
BrokerChooser Broker Awards
-

2024 Winner Best Trading Software
Stocks & Commodities Readers' Choice Award
-

2024 Excellence in Futures Education
Benzinga Global Fintech Awards
Why trade futures with NinjaTrader?
There are many reasons why traders of all skill levels choose to diversify their portfolios with futures. Futures offer flexible sizing that allows traders with less capital to enter the market, and they provide nearly 24-hour trading opportunities. With no shorting restrictions or day trading rules, futures traders have greater flexibility to take advantage of market conditions.
Whether you’re a new trader or seasoned veteran, you want a futures broker that supports you on your journey. With an extensive help center, live chat, and free daily livestreams presented by industry pros to help you analyze and trade the futures markets in real time, NinjaTrader provides multiple resources to help you build your futures trading strategy at your own pace. Get started today to learn more.
Access the most popular futures exchanges

CME Group is one of the world’s largest exchanges, offering a wide array of futures and options on futures products across different markets.

Gain exposure to European markets with Eurex futures. Offering a broad range of international benchmark products, Eurex operates the most liquid fixed income markets in the world.

Coinbase Derivatives offers highly correlated futures products that are smaller and more affordable contracts than the competition.

Intercontinental Exchange (ICE); was founded in 2000 to digitize the energy markets and provide greater price transparency.
FAQs about trading futures with NinjaTrader
What is a futures broker?
A futures broker is a registered firm that gives traders access to futures markets—places orders on regulated exchanges like CME Group, holds margin and customer funds in segregated accounts, and clears trades. In the U.S., futures brokers must register with the Commodity Futures Trading Commission as futures commission merchants (FCMs) and be NFA Members. NinjaTrader Clearing, LLC is an FCM and NFA Member (NFA ID: 0309379).
How do I choose a futures broker?
Compare four things: regulatory status (only trade with CFTC-registered FCMs that are NFA Members), commission and margin structure (especially intraday day-trading margins), platform quality (charting, mobile, simulator, order types), and exchange access. NinjaTrader offers $50 intraday margins on Micro E-minis, commissions from $0.09 per side, and direct access to CME Group, Eurex, ICE, and Coinbase Derivatives—all the major U.S. and European futures venues.
Is NinjaTrader a regulated futures broker?
Yes. NinjaTrader Clearing, LLC is registered with the Commodity Futures Trading Commission (CFTC) as a futures commission merchant (FCM) and is a Member of the National Futures Association (NFA ID: 0309379). All customer funds are held in segregated accounts as required by U.S. futures regulations.
What does it cost to trade futures with NinjaTrader?
NinjaTrader has no minimum deposit* and three pricing plans. Free plan: no monthly fee, commissions $0.39/Micro and $1.29/Standard per side. Monthly plan: $99/month with $0.29/Micro and $0.99/Standard. Lifetime plan: $1,499 one-time for the lowest rates, $0.09/Micro and $0.59/Standard. Intraday margins start at $50 per Micro contract. Exchange, clearing, and NFA fees apply on top of commissions.
*ACH and debit card transfers are subject to a $5.00 minimum.
Which exchanges does NinjaTrader provide access to?
NinjaTrader offers direct access to four major futures exchanges: CME Group (E-mini S&P 500, Micro E-minis, energy, metals, FX, Treasuries), Eurex (European fixed-income and equity index futures), ICE (Intercontinental Exchange—energy, agricultural, and currency futures), and Coinbase Derivatives (crypto futures including Bitcoin and Ether). Over 100 futures contracts are available to trade through a single NinjaTrader brokerage account.