Market data is essential to trading: it is the information that fuels charts, plots indicators and triggers alerts. Aside from the last traded price, market data can also include market depth, which provides additional insight as to what is going on beneath the surface.
These various market data points are grouped into two different categories which are frequently referenced in futures trading: Level I and Level II.
Level I Market Data
Level I data is basic market data, or the data immediately surrounding the last traded price. Level I data includes the following information:
- Bid Price – The highest price a trader is willing to pay for an asset
- Bid Size – The number of contracts or shares at the current bid price
- Ask Price – The lowest price a trader is willing to sell an asset for. The ask price is sometimes referred to as the offer price.
- Ask Size – The number of contracts or shares at the current ask price
- Last Price – The price at which the last posted trade occurred
- Last Size – The number of contracts or shares bought or sold in the last transaction
Level II Market Data
Level II data, also known as market depth, provides additional information beyond Level I data. Displaying orders at prices surrounding the last traded price, Level II data includes the following information:
- Highest Bid Prices – Multiple price levels below the current bid price where there are resting orders
- Bid Sizes – Quantities of contracts or shares ordered at each respective bid price level
- Lowest Ask Prices – Multiple price levels above the current ask price where there are resting orders
- Ask Sizes – Quantities of contracts or shares ordered at each respective ask price level
How Do Traders Use Level II Market Data?
Viewing Level II is a way of taking a snapshot of market sentiment at any given time. By viewing the current bids and offers, traders can use this information to help identify a bullish, bearish, or choppy market. When changes occur in bids and offers, this can be indicative of market shifts.
For example, if a trader were to see large bids building on the buy side, she might interpret this as a bullish signal. Likewise, if large sell orders begin to appear on the ask, this could be viewed as a bearish indication.
Not every trader uses Level II data the same as it can be interpreted many different ways. Traders should always be conscious of the risks involved in trading and that markets can be extremely unpredictable.
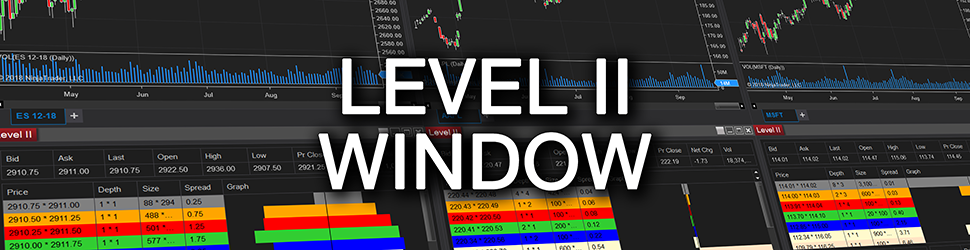
NinjaTrader’s Level II Window
Commonly viewed in the SuperDOM (DOM stands for “depth of market”), Level II data is accessible in much greater detail via the Level II Window. To open a Level II window in NinjaTrader, from the Control Center click New > Level II.

- The Quotes section displays market data items such as Bid, Ask, Last, Open, High, Low, Previous Close, Net Change, and Volume.
- The Summary section displays the total size at each price level. You can see both the Bid and Ask sizes for each price level in the Size column.
- The Details section separates the data into two separate columns, with Bid data on the left and Ask data on the right.
- Tabs below allow multiple instruments to be loaded within one Level II window.
Download NinjaTrader’s award winning trading platform for FREE and try your hand at Level II analysis! NinjaTrader is always free to use for advanced charting, backtesting and trade simulation.
