Creating a powerful, personalized workspace is one of the first steps in making the NinjaTrader Desktop platform your own. Whether you're trading on a single laptop screen or managing multiple monitors, the platform's modular design allows you to create an efficient layout that supports your strategy and trading flow.
Let’s break down the core components and walk through how to build a workspace from scratch.
Start with the control panel
When you first launch the NinjaTrader Desktop, the Control Panel appears automatically. This is the command center of your workspace. From here, you can:
- Connect to a data provider
- Access account information
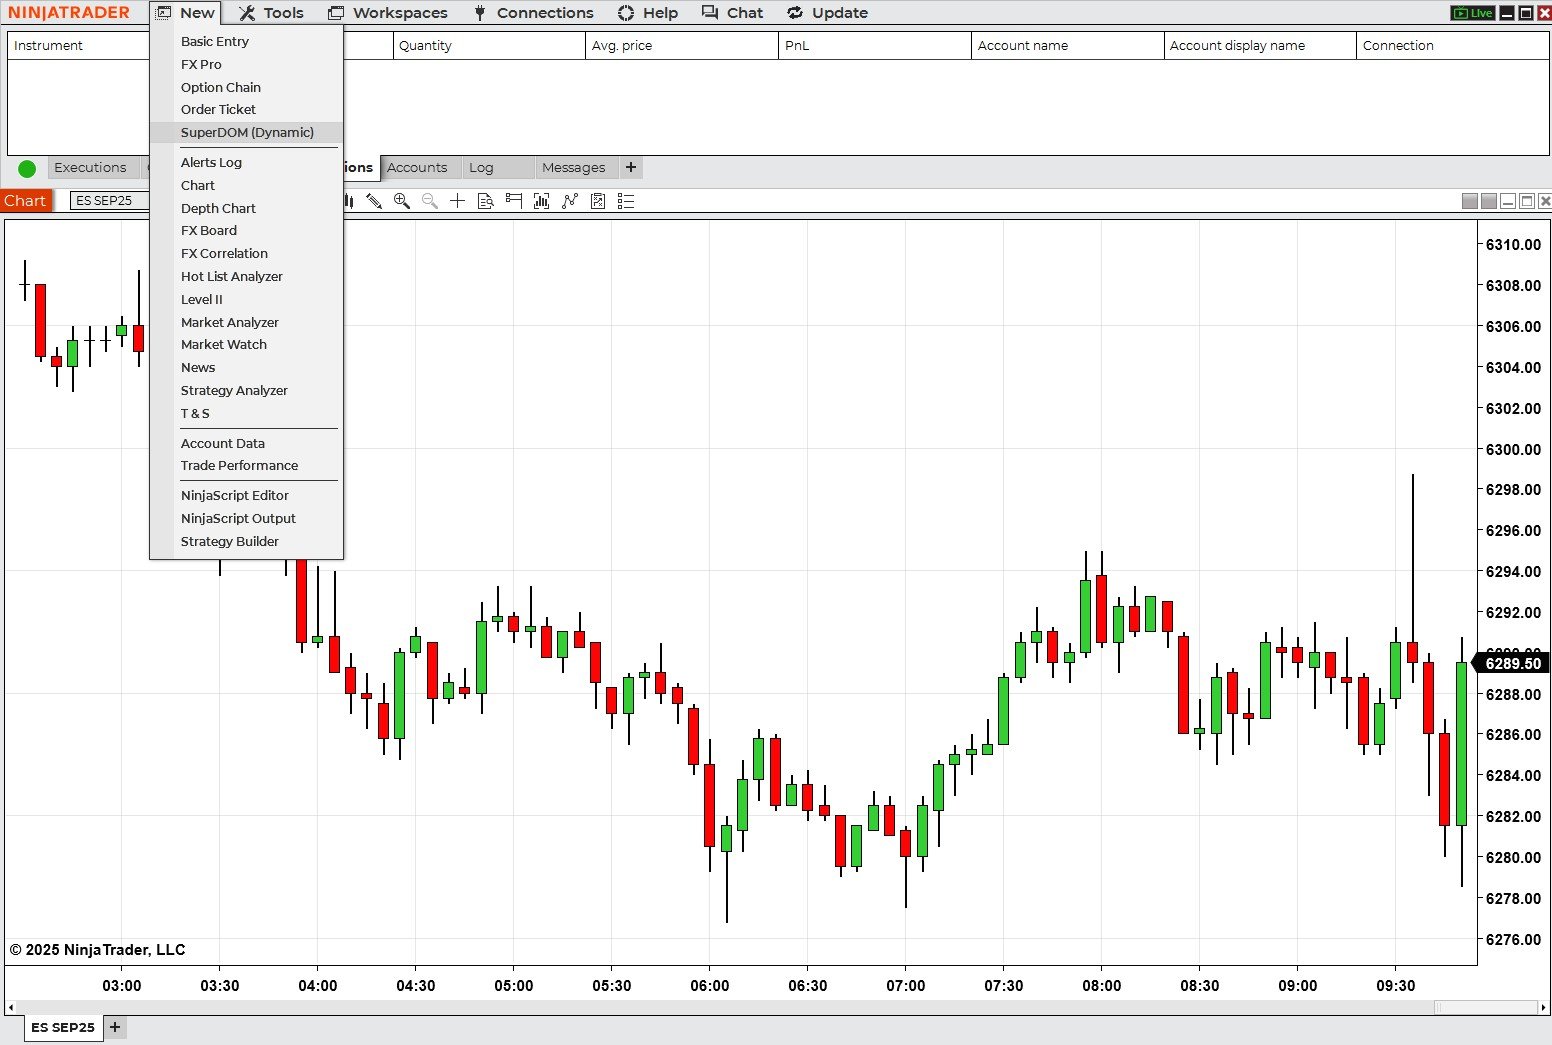
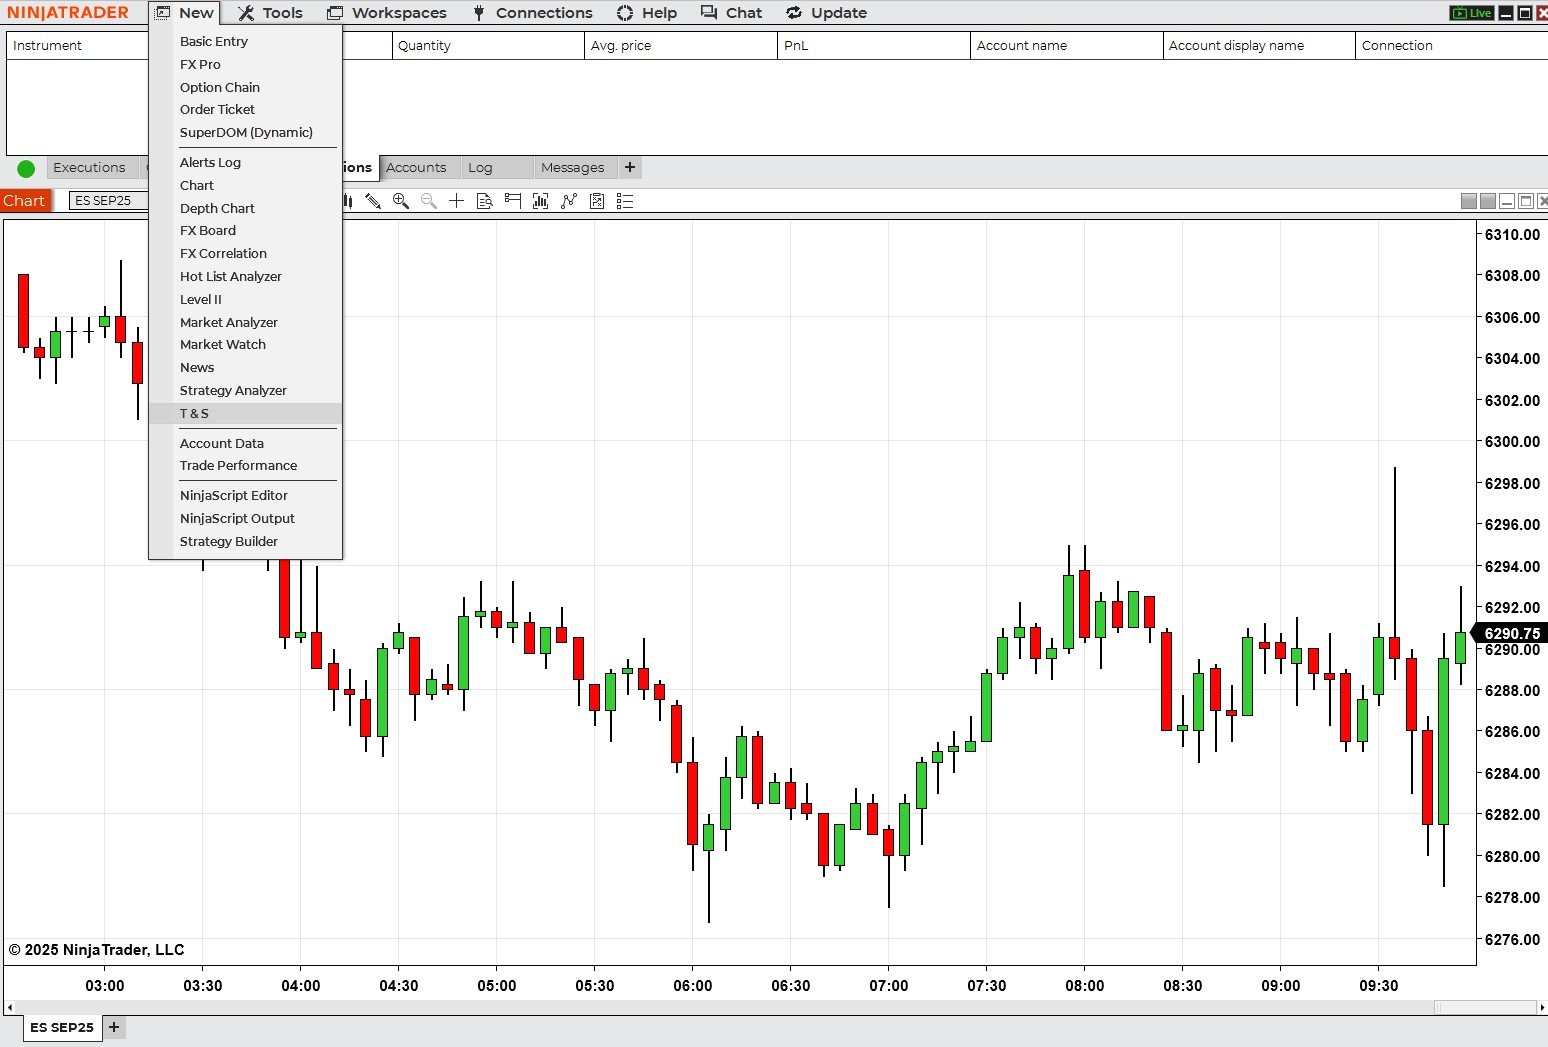
- Launch key features like charts, SuperDOMs, and analyzers
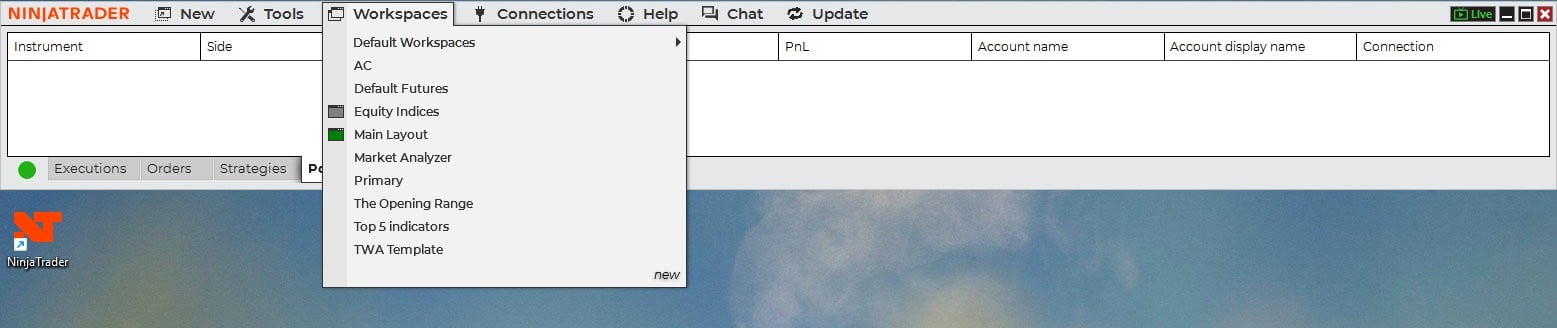
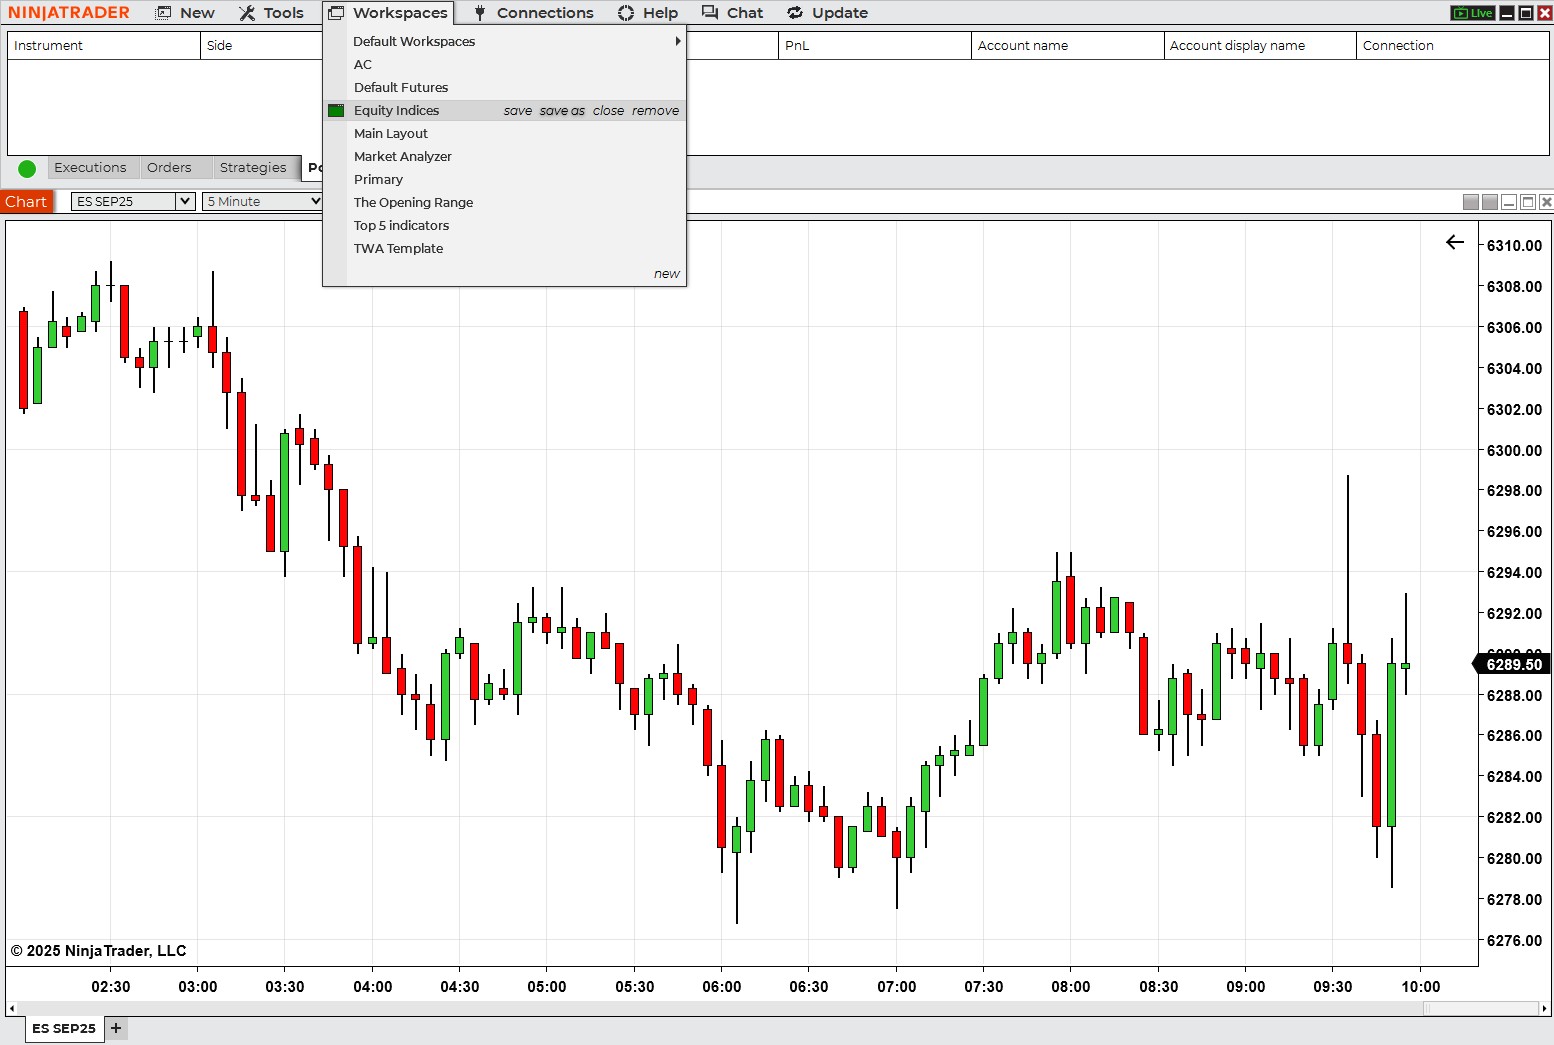
To create a new workspace, go to the top menu, select Workspaces, then click New. Give your workspace a name—something intuitive, like “Simple Start”—and you’re ready to begin adding components.
Add a Market Analyzer for real-time quotes
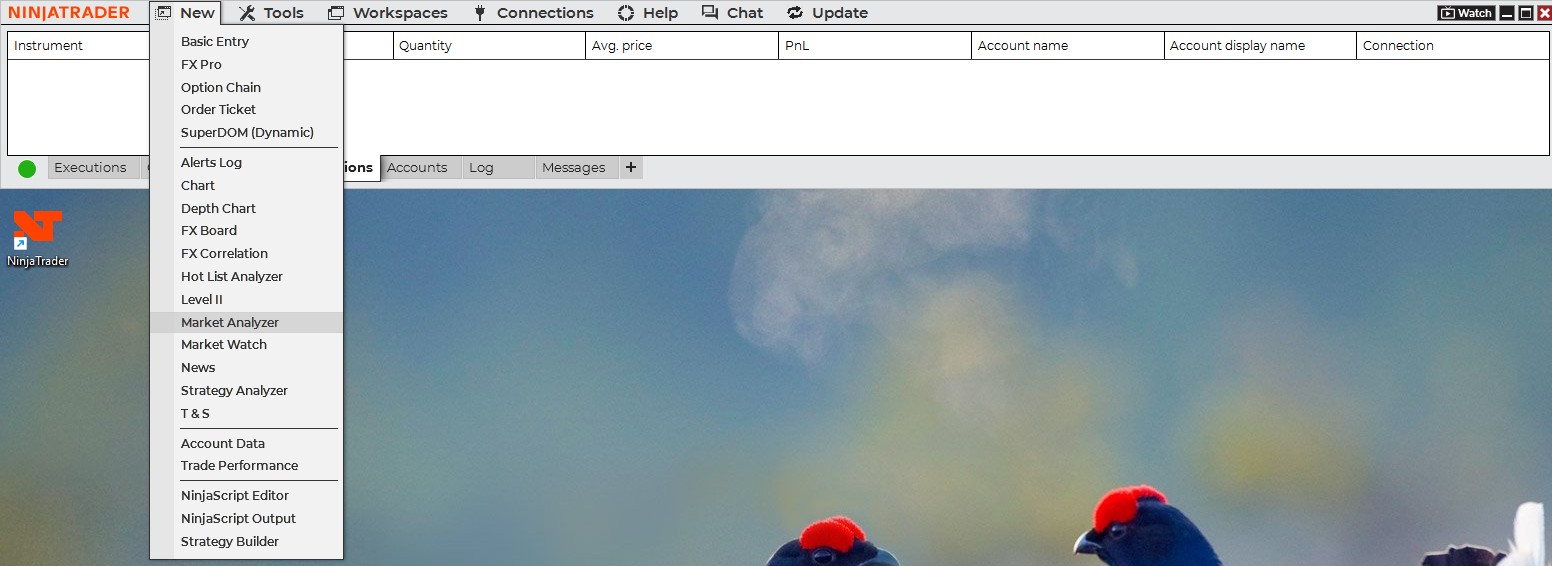
The Market Analyzer is your customizable quote board and more. To add it to your NinjaTrader Desktop workspace:
- Click New > Market Analyzer
- Right-click to add instruments (e.g., ES, MNQ, RTY, CL, 6E, GC)
- Use smart search to find markets by symbol or name
- Organize your instruments using Label Rows (e.g., “Stock Index Futures,” “Energy Futures”)
You can further personalize the Market Analyzer by color-coding label rows and adjusting visual preferences like highlight colors. This modular tool can help you stay on top of real-time price action across multiple asset classes.
Create your first chart in your NinjaTrader Desktop Workspace
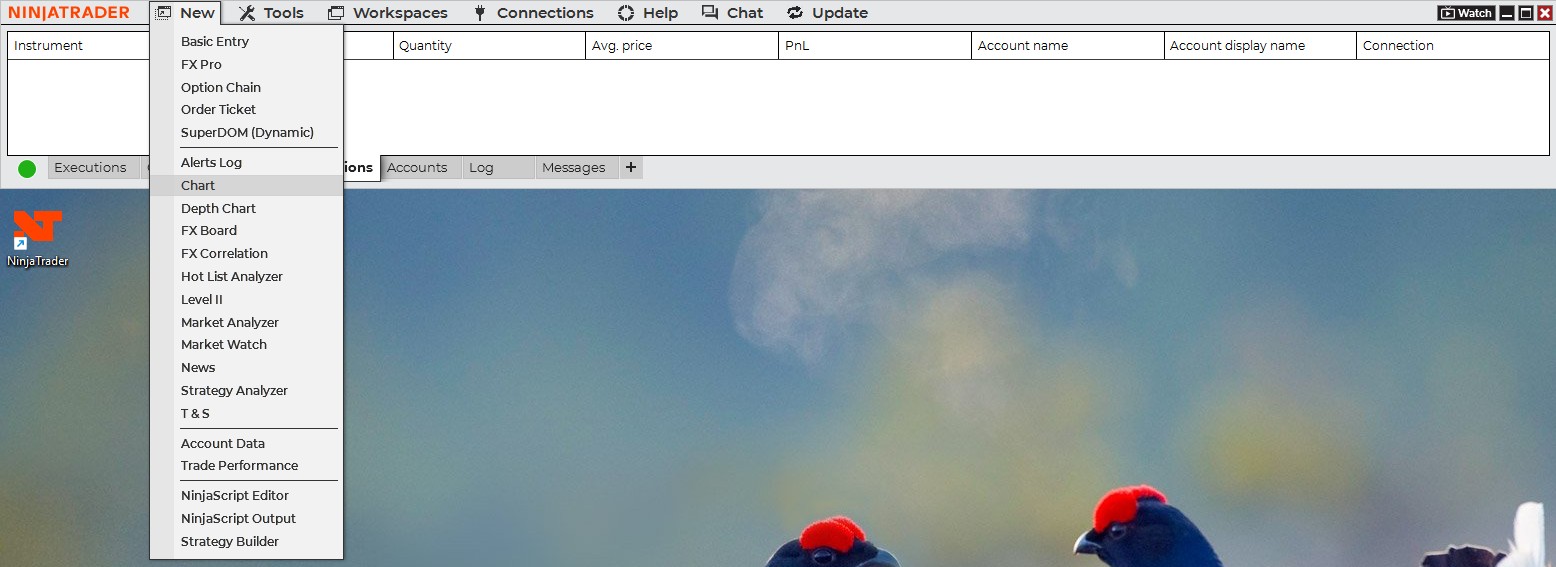
Charts are central to technical analysis. Here’s how to launch one:
- Click New > Chart
- Choose your instrument (e.g., gold futures)
- Select a time interval (e.g., 10-minute chart)
- Set how many days of data to display
- Pick your chart style (e.g., candlestick)
Once your chart is open, customize it further:
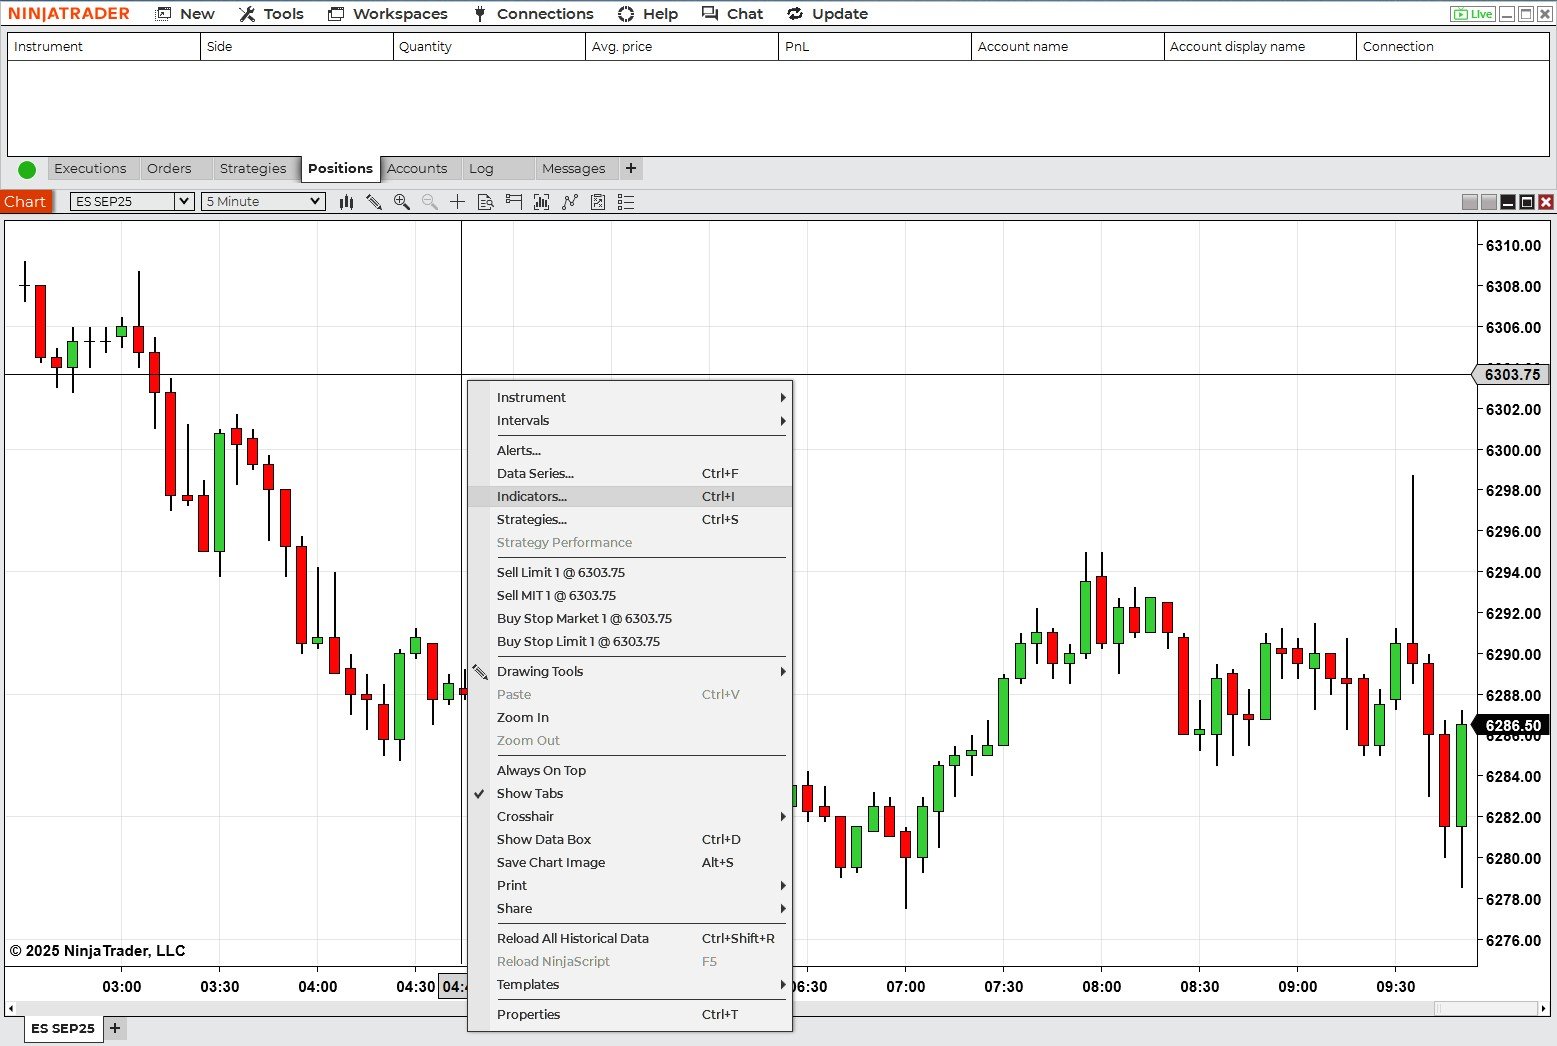
- Add indicators (e.g., Bollinger Bands, RSI)
- Adjust line colors, panel layout, and data calculation frequency
- Duplicate the chart into new tabs or windows to create multichart views
This flexibility can make it easier to monitor multiple timeframes or markets simultaneously.
Insert the SuperDOM for fast order entry
The NinjaTrader SuperDOM (depth of market) window allows for precise, fast-paced order execution. To add it:
- Click New > SuperDOM
- Choose either the static or dynamic version
- Select a simulated or live trading account
Position the SuperDOM wherever it fits your layout best. You can run multiple DOMs across different instruments for active trading in real time.
Link your windows for seamless navigation
One of the NinjaTrader Desktop workspace’s most efficient features is instrument linking. By color-coding your Market Analyzer, charts, and SuperDOM with the same instrument link (e.g., orange), a single click in the Market Analyzer updates all linked windows instantly.
This allows you to cycle through markets quickly without changing each chart or ladder manually.
Add time and sales to complete your view
For tick-by-tick insight, add a Time and Sales window:
- Click New > Time and Sales
- Link it to the rest of your workspace with the same instrument color
This tool can help you track order flow and volume as it happens, which can be especially helpful for short-term strategies.
Save your workspace and log off
Once you’ve set up your ideal layout, save it:
- Click Workspaces > Save
- When you’re done trading, close the workspace via the Control Panel X, not via individual windows
This ensures everything will reopen just as you left it during your next session.
Use workspaces to match your trading goals
The NinjaTrader Desktop supports multiple workspaces, each tailored to different needs. For example:
- Dedicated charting workspace for presession analysis
- Workspace focused on energy futures
- Real-time execution layout for day trading
Toggling between them is simple and quick and can help keep your trading organized and efficient.

Empower your trading experience
Building your NinjaTrader Desktop workspace is more than just adding charts and tools—it's about creating a personalized environment that fits your strategy and style. Whether you're just starting out or fine-tuning a multimonitor command center, NinjaTrader’s intuitive design puts you in control.
