Coverage for the week of May 29th – June 2nd: In this week’s coverage, we examine rallies in the E-Mini Dow Jones and Silver futures, and the bearish trends in Euro FX and Natural Gas futures. We also examine the economic report releases for the shortened week.
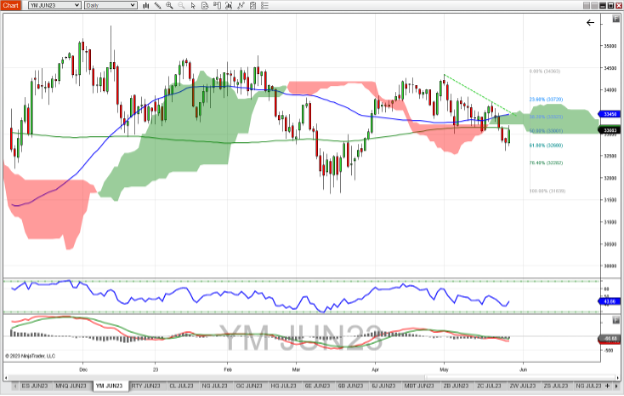
June E-Mini Dow Jones Future Daily Chart
The June E-Mini Dow Jones future continued the current downtrend that started at the beginning of May. Bearish signals included price crossing below both the 50-day and 200-day moving averages, though Friday saw a big rally back up to the 200 DMA. The MACD continues to be bearish, and the trend on the RSI is in line with price trend. Friday’s rally completes a 3-bar reversal pattern, which suggests a turnaround could be in the works. Should a rally continue above the 200-DMA, look for resistance at the Ichimoku cloud (~33210) and the 38% Fibonacci retracement (~33320) as measured from the low on March 15th to the high on May 1st. Support could be found at the 61.8% Fib level (32680) should this trend revert bearish.

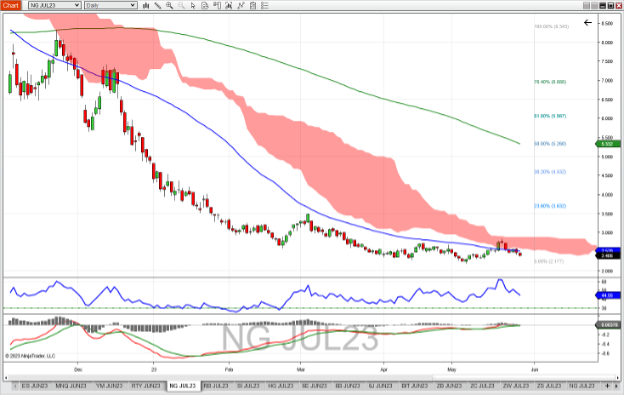
July Natural Gas Future Daily Chart
The July Natural Gas future could not continue the rally that saw a cross above the 50-day moving average two weeks ago. Monday started off with a bearish candle to cap a 3-bar rally formation, and finished the week trading entirely below the same 50 DMA. This reversal also brought price back below the Ichimoku cloud – which is considered bearish. RSI is trending in line with price, and the MACD is indecisive as it is wrapped up around the zero line. Should this downtrend extend, look for recent low of 2.191 act as possible support. A reverse to the up side might experience resistance at the bottom of the cloud (~2.580) and the top of the cloud (~2.900). The 23% Fibonacci retracement (3.632) would be a reach but possible resistance as well.

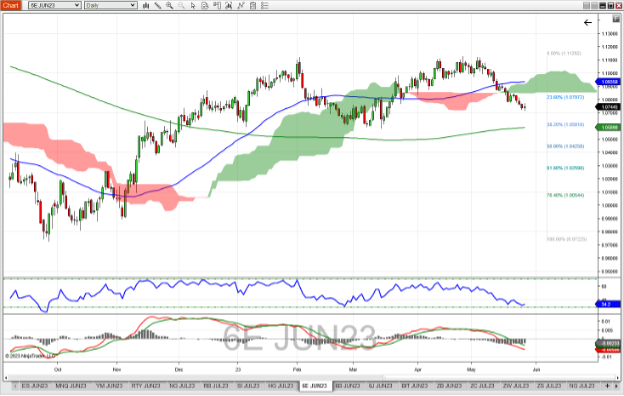
June Euro FX Future Daily Chart
The June Euro FX Future continued its slide after hitting the ceiling of ~1.11290. The bottom of the Ichimoku cloud acted as resistance Monday with three consecutive bearish candles following. This also caused a cross below of the 23% Fibonacci retracement from October 2022 lows to recent highs in May. The MACD and its histogram both are bearish, and while the RSI at 34 is near the oversold level of 30, early signs of divergence are occurring as the peak lows in price are lower but the lows in RSI are flat. Should Friday’s doji turn this market bullish, look for resistance at 1.07972 (23% Fib level) and ~1.085 (bottom of the Ichimoku cloud). Support may be found at the confluence of the 38.2% Fib level and the 200-day moving average (1.05918).

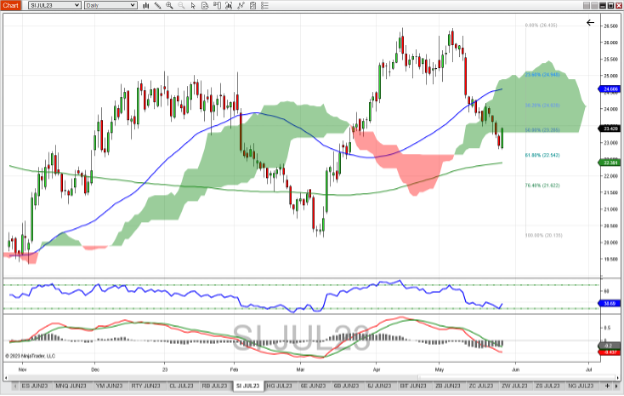
July Silver Future Daily Chart
The July Silver future rallied Friday after spending most of the week down. This rally placed silver back into the Ichimoku cloud after trading fully below it the previous day. It also put silver above the 50% Fibonacci retracement level, formed by measuring the bull trend from March 10th to May 5th. While the bear trend is supported by the cross below the 50-day moving average two weeks ago, Friday’s reversal occurs above the 200-day moving average, which could indicate a longer bull trend. The MACD continues to be bearish in both the MACD line (below 0) and the MACD Histogram (also below 0). RSI is in line with price, reflecting off the oversold level of 30. Should buyers continue to lift this market, look for resistance at the 38% Fib level (24.02) and the 50 DMA (~24.60). Support might be found at the 61.8% Fib retracement level (22.542).

Economic Reports for the Week of May 29th – June 2nd
Commentary: Housing, Manufacturing and Labor take the stage in this shortened week. Case Shiller Home and FHFA House Price Indices drop Tuesday morning, with the weekly MBA Mortgage report arriving early Wednesday morning.
Manufacturing reports are also spread out this week, with Dallas Fed Manufacturing Survey (Tuesday), Chicago PMI (Wednesday) and three Thursday reports: PMI Manufacturing Final, Construction Spending, and ISM Manufacturing Index. Also on Thursday, EIA is doing double duty as the Natural Gas report releases at 10:30 AM and the Petroleum Report at 11:00 AM.
Reports concerning the Labor Market arrive Wednesday (Job Opening and Labor Turnover Survey, or JOLTS), Thursday (Challenger Job-cut Report and Jobless Claims) and Friday (Employment Situation). As stabilizing the Labor Market is one of the mandates of the Federal Reserve, these reports could help shape opinion on how the Fed Funds rate may change at the next FOMC meeting.
Federal Reserve Bank Presidents Harker, Barkin and Collins are set to speak this week, but be aware other Fed speakers may have unscheduled appearances that could affect the market.
| Date | Economic Reports |
|---|---|
| Monday, May 29th | Market Holiday: Memorial Day |
| Tuesday, May 30th | 9:00 AM ET: Case-Shiller Home Price Index 9:00 AM ET: FHFA House Price Index 10:00 AM ET: Consumer Confidence* 10:30 AM ET: Dallas Fed Manufacturing Survey* 11:00 AM ET: Export Inspections 1:00 PM ET: Richmond Federal Reserve Bank President Thomas Barkin Speech 4:00 PM ET: Crop Progress |
| Wednesday, May 31st | 7:00 AM ET: MBA Mortgage Applications 8:50 AM ET: Boston Federal Reserve Bank President Susan Collins Speech 9:45 AM ET: Chicago PMI 10:00 AM ET: JOLTS* 12:20 PM ET: Boston Federal Reserve Bank President Susan Collins Speech 1:30 PM ET: Philadelphia Federal Reserve Bank President Patrick Harker Speech 2:00 PM ET: Beige Book 3:00 PM ET: Farm Prices 4:30 PM ET: API Weekly Oil Stocks |
| Thursday, June 1st | 7:30 AM ET: Challenger Job-Cut Report 8:15 AM ET: ADP Employment Report 8:30 AM ET: Jobless Claims*** 8:30 AM ET: Productivity and Costs 9:45 AM ET: PMI Manufacturing Final 10:00 AM ET: Construction Spending 10:00 AM ET: ISM Manufacturing Index 10:30 AM ET: EIA Natural Gas Report* 11:00 AM ET: EIA Petroleum Status Report* 1:00 PM ET: Philadelphia Federal Reserve Bank President Patrick Harker Speech 3:00 PM ET: Grain Crushings 3:00 PM ET: Fats & Oils 4:30 PM ET: Fed Balance Sheet |
| Friday, June 2nd | 8:00 AM ET: Motor Vehicle Sales 8:30 AM ET: Employment Situation* 8:30 AM ET: Export Sales 1:00 PM ET: Baker Hughes Rig Count |
*** Market Moving Indicators
* Merit Extra Attention
Get Started with NinjaTrader
NinjaTrader supports more than 800,000 traders worldwide with a powerful and user-friendly trading platform, discount futures brokerage and world-class support. NinjaTrader is always free to use for advanced charting and strategy backtesting through an immersive trading simulator.
Download NinjaTrader’s award-winning trading platform and get started with a free trading demo with real-time market data today!

