Coverage for the week of May 15th – May 19th: In this week’s coverage, we examine the pullback in the E-Mini Dow Jones and Euro FX futures, consolidation in the 10-Year Note future and the bullish trend in Gold futures. We also examine the economic report releases expected in the coming days.
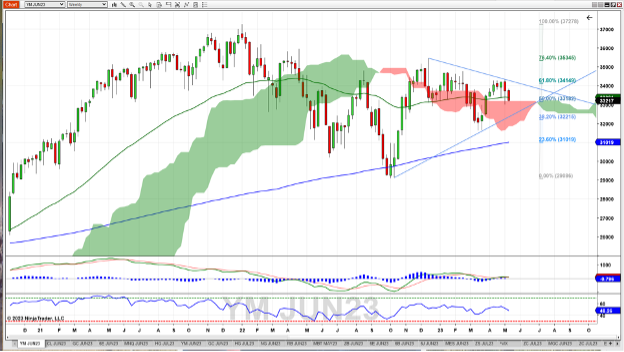
June E-Mini Dow Jones 2000 Future Weekly Chart
The June E-Mini Dow Jones future continued to slide, crossing below the 52-week moving average and finding support at the top of the Ichimoku cloud. This level coincides with the 50 percent retracement from the low in October to the high in December. A wedge formation is forming from recent highs and lows going back to October – price is sitting squarely in the middle of the declining range. The MACD is showing a bearish cross with this past week’s down close, though the RSI is just under a neutral reading at 48. Should the Dow continue its downtrend, look for support at the bottom of the wedge (~32400) and the 38 percent retracement level (32215). Resistance may occur at the top of the wedge, which coincides with the 61 percent Fib retracement level (~33150).

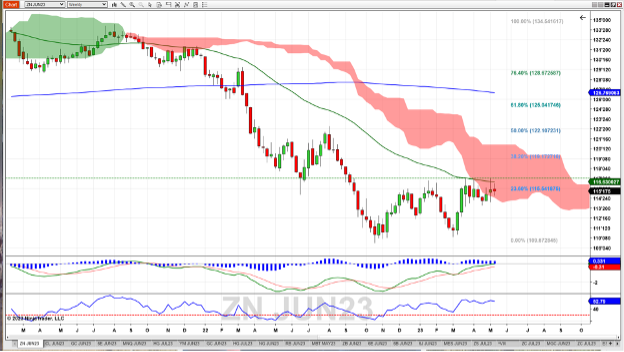
June 10-Year Note Future Weekly Chart
The June 10-Year Note future showed little advance as denoted by the small body and smaller wicks last week, finding a close just at the 23 percent Fibonacci retracement from the high in August 2021 to the low in October 2022. The 52-week moving average held as resistance, and not much penetration was made into the Ichimoku cloud. The MACD histogram continues to be bullish however, and the MACD itself crossed into positive territory last week. The RSI reflects price activity, showing a neutral reading of 53 and sideways. Should the bullish trend continue, look for resistance at ~116’20 (52-week moving average) and 117 (previous resistance area). A trend down could experience possible support at recent lows of 113’28.

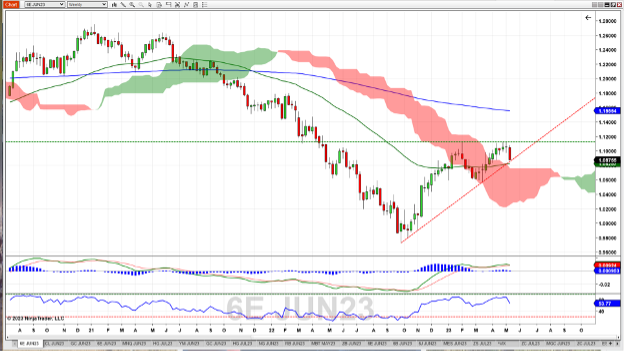
June Euro FX Future Weekly Chart
The rally failed in a big way last week as the June Euro FX future gave back five weeks’ worth of advances. While the plunge stopped short of testing the 52-2week moving average, the rising trend line was tested at the week’s low. The MACD is on the cusp of a bearish cross, and RSI tracking in line with price bearishness. Should the Euro FX continue to trend down, support might be found at the 52-week MA (1.0825) and the top of the Ichimoku cloud (1.p76). A reversal to the upside could see resistance at the previously-tested level of 1.1125.

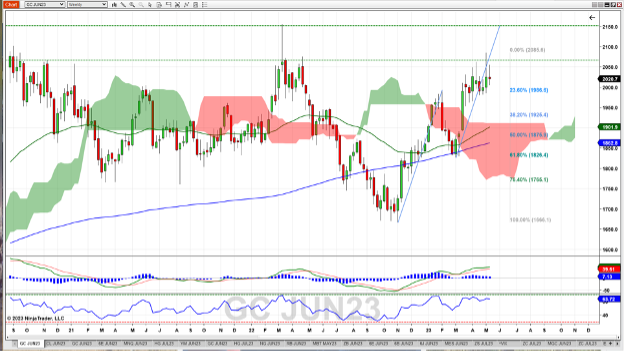
June Gold Future Weekly Chart
The June Copper future showed little advancement last week, staying within the 1975 – 2050 range it has found in the last two months. It couldn’t get back to the 2070 area it tested the prior week – an area that was tested at the end of 2020 and again in early 2022. Price is well above the 52-week and 200-week moving averages, and the Ichimoku cloud as well. MACD and the MACD Histogram are positive, a bullish state. RSI shows some signs of divergence, as the RSI peaks are declining during this year’s bullish price action. Should the uptrend continue, look for possible resistance at 2070 (previous resistance area) and 2150 (as measured by the extension of the previous trend from November to February as applied to the recent low in March). The Fibonacci retracement tool shows possible support at the 23.6 percent level (1986).

Economic Reports for the Week of May 15th – May 19th
Commentary: Federal Reserve presidents hit the speaking trail, as no less than eight instances occur, beginning with Atlanta Fed President Bostic’s speech before regular trading hours Monday. Look for New York Fed President Williams on Wednesday and Friday to have possible impact on stock index futures.
Note that this may not be a comprehensive list of Fed officers speaking this week as impromptu engagements occur frequently.
In an otherwise light planned news week, Tuesday and Thursday comprise the bulk of the reports. Housing is in focus as the Housing Market Index report drops Tuesday morning and Starts and Permits on Wednesday morning.
Manufacturing reports from New York (Monday pre-market) and Philadelphia (Thursday pre-market) could provide insight on how the market regards the Fed’s attempts at thwarting inflation. Monday’s Treasury International Capital report offers a look into foreign demand for U.S. debt and assets.
| Date | Economic Release |
|---|---|
| Monday, May 15th | 8:30 AM ET: Empire State Manufacturing Index* 8:45 AM ET: Atlanta Federal Reserve Bank President Raphael Bostic Speech 11:00 AM ET: Export Inspections 12:30 PM ET: Richmond Federal Reserve Bank President Thomas Barkin Speech 4:00 PM ET: Crop Progress 4:00 PM ET: Treasury International Capital |
| Tuesday, May 16th | 8:15 AM ET: Cleveland Federal Reserve Bank President Loretta Mester Speech 8:30 AM ET: Retail Sales 8:55 AM ET: Atlanta Federal Reserve Bank President Raphael Bostic Speech 9:15 AM ET: Industrial Production 10:00 AM ET: Business Inventories 10:00 AM ET: Housing Market Index 12:15 PM ET: New York Federal Reserve Bank President John Williams Speech* 3:15 PM ET: Dallas Federal Reserve Bank President Lorrie Logan Speech 4:30 PM ET: API Weekly Oil Stocks 7:00 PM ET: Atlanta Federal Reserve Bank President Raphael Bostic |
| Wednesday, May 17th | 7:00 AM ET: MBA Mortgage Applications 8:30 AM ET: Housing Starts and Permits 10:30 AM ET: EIA Petroleum Status Report* |
| Thursday, May 18th | 8:30 AM ET: Export Sales 8:30 AM ET: Jobless Claims*** 8:30 AM ET: Philadelphia Fed Manufacturing Index* 8:30 AM ET: Leading Indicators 10:00 AM ET: E-Commerce Retail Sales 10:00 AM ET: Existing Home Sales 10:30 AM ET: EIA Natural Gas Report* 4:30 PM ET: Fed Balance Sheet |
| Friday, May 19th | 8:30 AM ET: Import and Export Prices 8:45 AM ET: New York Federal Reserve Bank President John Williams Speech* 10:00 AM ET: Quarterly Services Survey 1:00 PM ET: Baker Hughes Rig Count 3:00 PM ET: Cattle On Feed |
*** Market Moving Indicators
* Merit Extra Attention
Get Started with NinjaTrader
NinjaTrader supports more than 800,000 traders worldwide with a powerful and user-friendly trading platform, discount futures brokerage and world-class support. NinjaTrader is always free to use for advanced charting and strategy backtesting through an immersive trading simulator.
Download NinjaTrader’s award-winning trading platform and get started with a free trading demo with real-time market data today!

