In this week’s coverage, we analyze the bullish trends in Micro Nasdaq 100 Index and 10-year note futures, and the consolidating activity in Micro Bitcoin and RBOB gasoline futures. We also examine the economic reports expected next week.
Commentary and charts reflect data at the time of writing. Market conditions are subject to change and may not reflect all market activity.
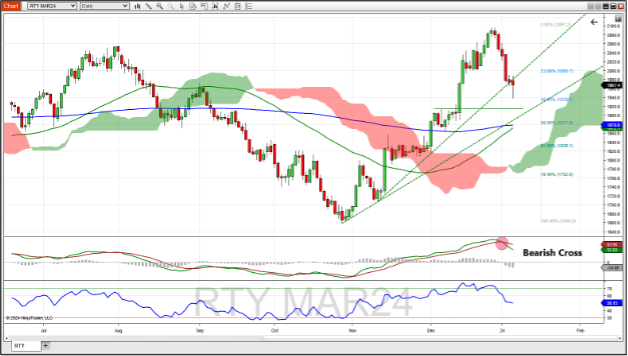
March E-Mini Russell 2000 Index Futures Daily Chart
March E-mini Russell 2000 Index futures began the year in the negative with four consecutive down days, breaking below a trend line determined by connecting lows in November and December. The MACD showed a bearish cross to start the year and the RSI crossed below its overbought level of 70, and is now printing at 50. Possible areas of support should the bearish trend continue: The 38.2% Fibonacci retracement level (~1,929), a former area of resistance (1,915), and a supportive trend line found by connecting lows from October to November (~1,900) . A rally might find resistance at the 23.6% Fib level (~1,993).

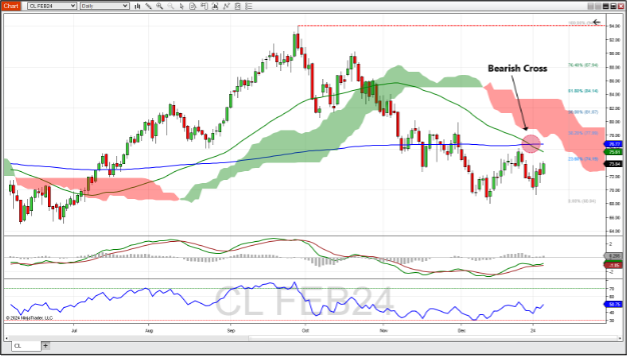
February WTI Crude Oil Futures Daily Chart
February WTI crude oil futures rebounded last week after a small pullback to finish the year. Crude started the year with a bearish signal when the 50-day moving average crossed below the 200-day moving average. The RSI and MACD are showing slightly bullish indications, as the MACD histogram is positive, and the RSI is trending up along with price. The 23.6% Fibonacci retracement level was tested on Friday and held as resistance. Should this rally continue, expect resistance at the 50-day moving average (~75.60), the 200-day moving average (~76.77), and the bottom of the Ichimoku cloud (~77.75). A bearish trend could see support at the recent low of 68.04.

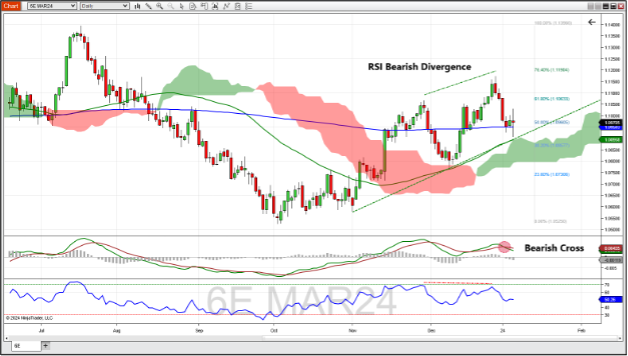
March Euro FX Futures Daily Chart
March euro FX futures began the year in bare mode but seems to have found support at the 200-day moving average. This corresponds with the 50% Fibonacci retracement level of the downtrend from mid-July to early October. Euro FX futures also tested the support line determined by joining the lows in November and December. MACD showed a bearish cross to start the year and RSI showed bearish divergence before last week, with higher peak highs in price but lower peak highs in the RSI. A breakdown could see support at the intersection of the 50-day moving average, the previously mentioned supportive trend line, and top of the Ichimoku cloud (~1.0895). Further support might be found at the 38.2% Fib level (1.08577). A rally might see resistance at the 61.8% Fib level (1.10633).

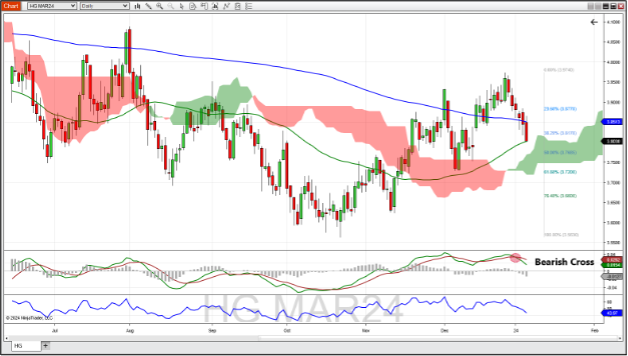
March Copper Futures Daily Chart
March copper futures continued its bearish trend with all four days of the new year showing a lower close. This brought the price of copper below its 200-day moving average with the 50-day moving average being tested as support to finish the week. The MACD showed a bearish cross to start the week, and the RSI trended downward with price though, at 44, is still a way away from being oversold. Should the bearish trend continue, support might be found at the top of the Ichimoku cloud, which might correspond with the 50% Fibonacci retracement level of the previous uptrend (~3.77). Further support could be found at the 61.8% Fib level (3.72). A rally to the upside could see resistance at the 200-day moving average (~3.85) as well as the 23.6% Fib level (~3.88).

Economic Reports for the week of January 8 – January 12
This week is a relatively light news week, but don’t let that fool you – some big numbers are released toward the end of this week. Thursday morning will see two big reports – the Consumer Price Index (expected to tick up 0.1% to 3.2% from last month’s number) and Jobless Claims (also forecast to increase to 212,000 new claims from last week’s 202,000 claims) occur at 8:30 AM ET.
This is the last CPI report before the next FOMC meeting, which takes place January 31. The Producer Price Index (PPI) follows on Friday morning, but the impact on futures markets usually is less than that of CPI.
Also on Friday, the USDA releases the World Agricultural Supply and Demand Estimates, which can move prices in the corn, soybean, wheat, cotton and other agriculture markets. Federal Reserve Members are slated to speak every day except Thursday — look for New York Federal Reserve Bank President John Williams on Wednesday to be one not to miss. The trade balance information on Tuesday morning is forecast to show an increase in the trade deficit to $-64.8B.
| Date | Economic Report |
|---|---|
| Monday, January 8 | 11:00 AM ET: Export Inspections 12:30 PM ET: Atlanta Federal Reserve Bank President Raphael Bostic Speech 3:00 PM ET: Consumer Credit |
| Tuesday, January 9 | 6:00 AM ET: NFIB Small Business Optimism Index 8:30 AM ET: International Trade in Goods and Services 12:00 PM ET: FOMC Member Michael Barr Speaks 4:30 PM ET: API Weekly Oil Stocks |
| Wednesday, January 10 | 7:00 AM ET: MBA Mortgage Applications 10:00 AM ET: Wholesale Inventories (Preliminary) 10:30 AM ET: EIA Petroleum Status Report * 3:15 PM ET: New York Federal Reserve Bank President John Williams Speech * |
| Thursday, January 11 | 8:30 AM ET: CPI *** 8:30 AM ET: Jobless Claims *** 8:30 AM ET: Export Sales 10:30 AM ET: EIA Natural Gas Report * 2:00 PM ET: Treasury Statement 4:30 PM ET: Fed Balance Sheet |
| Friday, January 12 | 8:30 AM ET: PPI-Final Demand * 10:00 AM ET: Minneapolis Federal Reserve Bank President Neel Kashkari Speech 12:00 PM ET: USDA Supply/Demand - Wheat, Corn, Soybean, Cotton *** 12:00 PM ET: Winter Wheat Seedings 12:00 PM ET: Crop Production 12:00 PM ET: Grain Stocks 1:00 PM ET: Baker Hughes Rig Count |
*** Market Moving Indicators
* Merit Extra Attention
Ready For More?
Learn the basics of technical analysis with our free multi-video trading course, “Technical Analysis Made Easy.”
Join our daily livestream events as we prepare, analyze and trade the futures markets in real time.
Start Trading Futures With NinjaTrader
NinjaTrader supports over 1 million users worldwide with our award-winning trading platforms, world-class support and futures brokerage services with $50 day trading margins. The NinjaTrader desktop platform is always free to use for advanced charting, strategy backtesting, technical analysis and trade simulation.
Get to know our:
- Futures brokerage: Open an account size of your choice—no deposit minimum required—and get free access to our desktop, web and mobile trading platforms.
- Free trading simulator: Sharpen your futures trading skills and test your ideas risk-free in our simulated trading environment with 14 days of livestreaming futures market data.
Better futures start now. Open your free account to access NinjaTrader’s award-winning trading platforms, plus premium training and exclusive daily market commentary.

