Volume profile is a charting tool that displays the total trading volume executed at each individual price level across a selected time period, plotted horizontally on the price axis. Unlike a standard volume bar chart that shows volume per time interval, volume profile reveals where the market spent the most volume—exposing significant support, resistance, and value areas. Recurring profile shapes (D, P, b, B) signal balance, exhaustion, or trend continuation, giving futures traders a structured framework for reading market behavior.
Below are the four common volume profile shapes and how order flow traders can interpret them.
P-Shaped Volume Profile
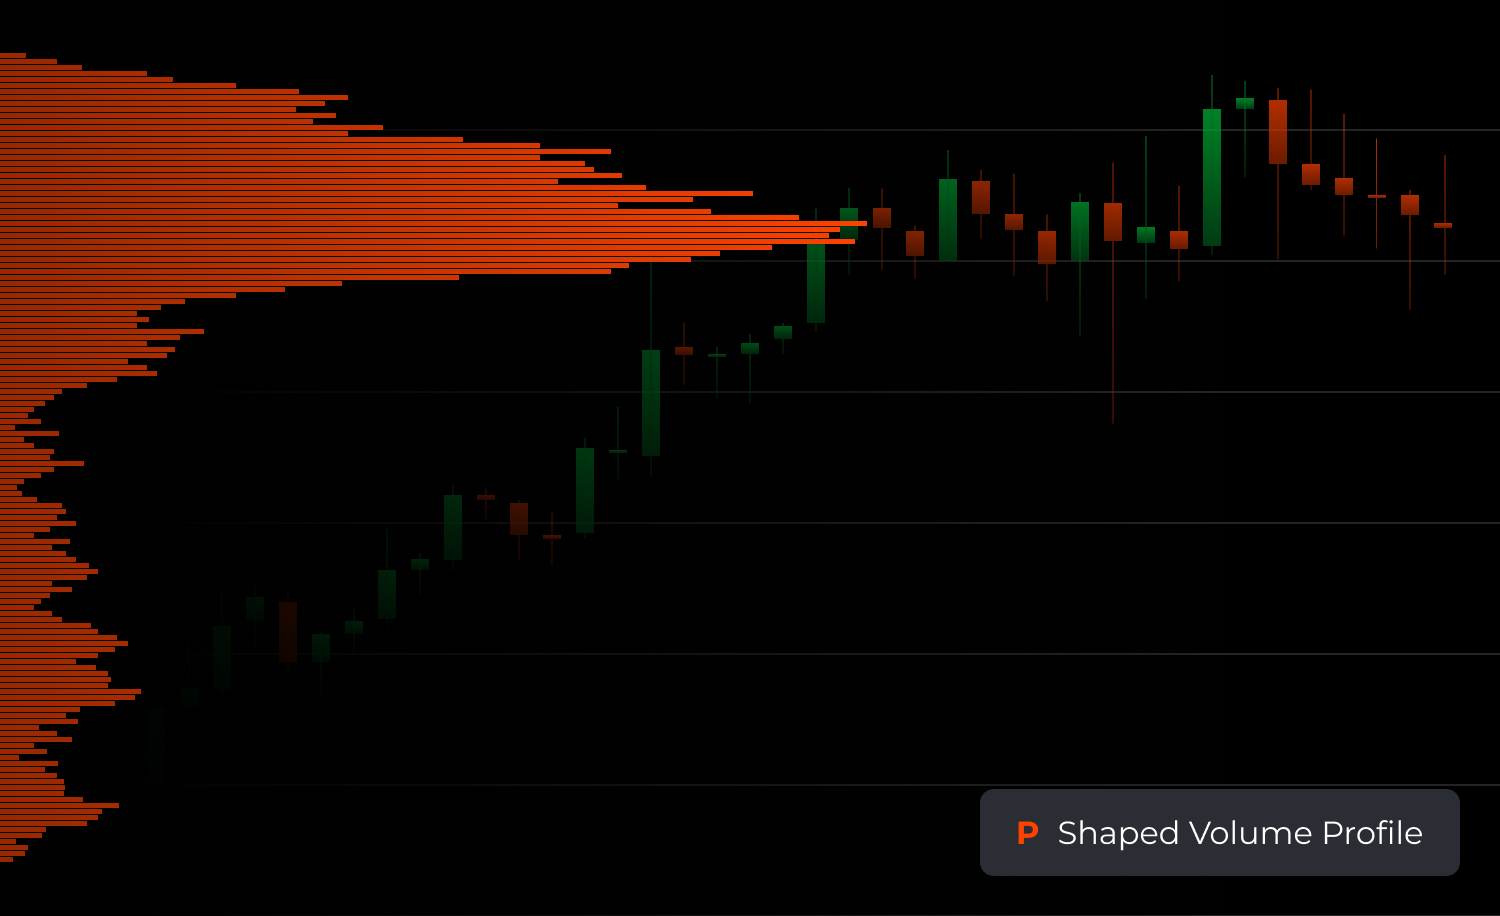
A P-shaped volume profile typically occurs when a market rises sharply and then consolidates. After price reaches the upper end of a P-shaped profile, there can be a period of consolidation where balance is reached between buyers and sellers.
The lower portion of a P-shaped profile is long and thin, representing low volume rejection. The wider upper section represents where a "fair" price was reached and trading activity elevated.
While P-shaped profiles often occur during uptrends, a P-shaped profile can also mark the end of a downtrend indicating a possible short covering rally. Since short covering is usually seen as temporary strength within a market, P-shaped profiles can be interpreted as bullish signals.
b-Shaped Volume Profile
A b-shaped volume profile forms when a market falls sharply and then consolidates. The opposite of a P-shaped profile, a b-shaped volume profile can occur as a result of long liquidation. While P-shaped profiles represent short covering, b-shaped profiles represent a period of selling before balance is found in a market.
The upper portion of a b-shaped profile is long and thin representing low volume and an "unfair" perception of price. The wider bottom section represents where price once again reached a balance between buyers and sellers.
b-shaped profiles are commonly found during downtrends but when a b shape is seen during an uptrend, it can potentially indicate a reversal. Because b-shaped profiles represent longs exiting the market, they are generally understood as bearish signals.
D-Shaped Volume Profile
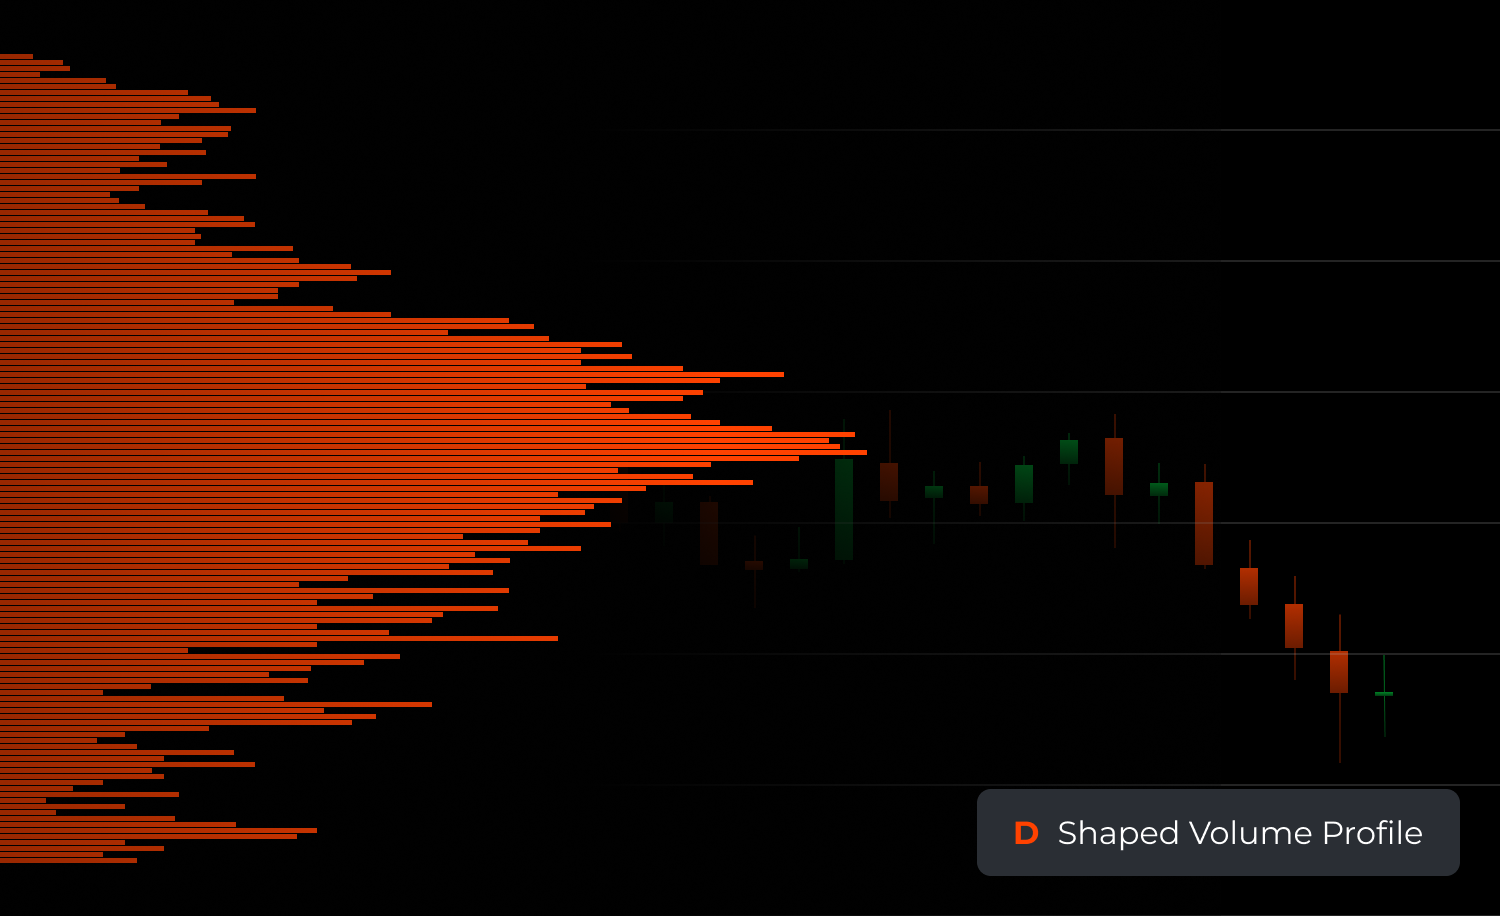
D-shaped profiles occur when there is a temporary balance in a market. The point of control (POC) is typically located in the center of the profile indicating a balance between buyers and sellers.
Some traders might interpret a D-shaped profile as a choppy or sideways market that lacks a clear direction, since neither buyers nor sellers were more aggressive. However, patient order flow traders might seek out D-shaped volume profiles in anticipation of a potential breakout in either direction as institutional players build up their positions.
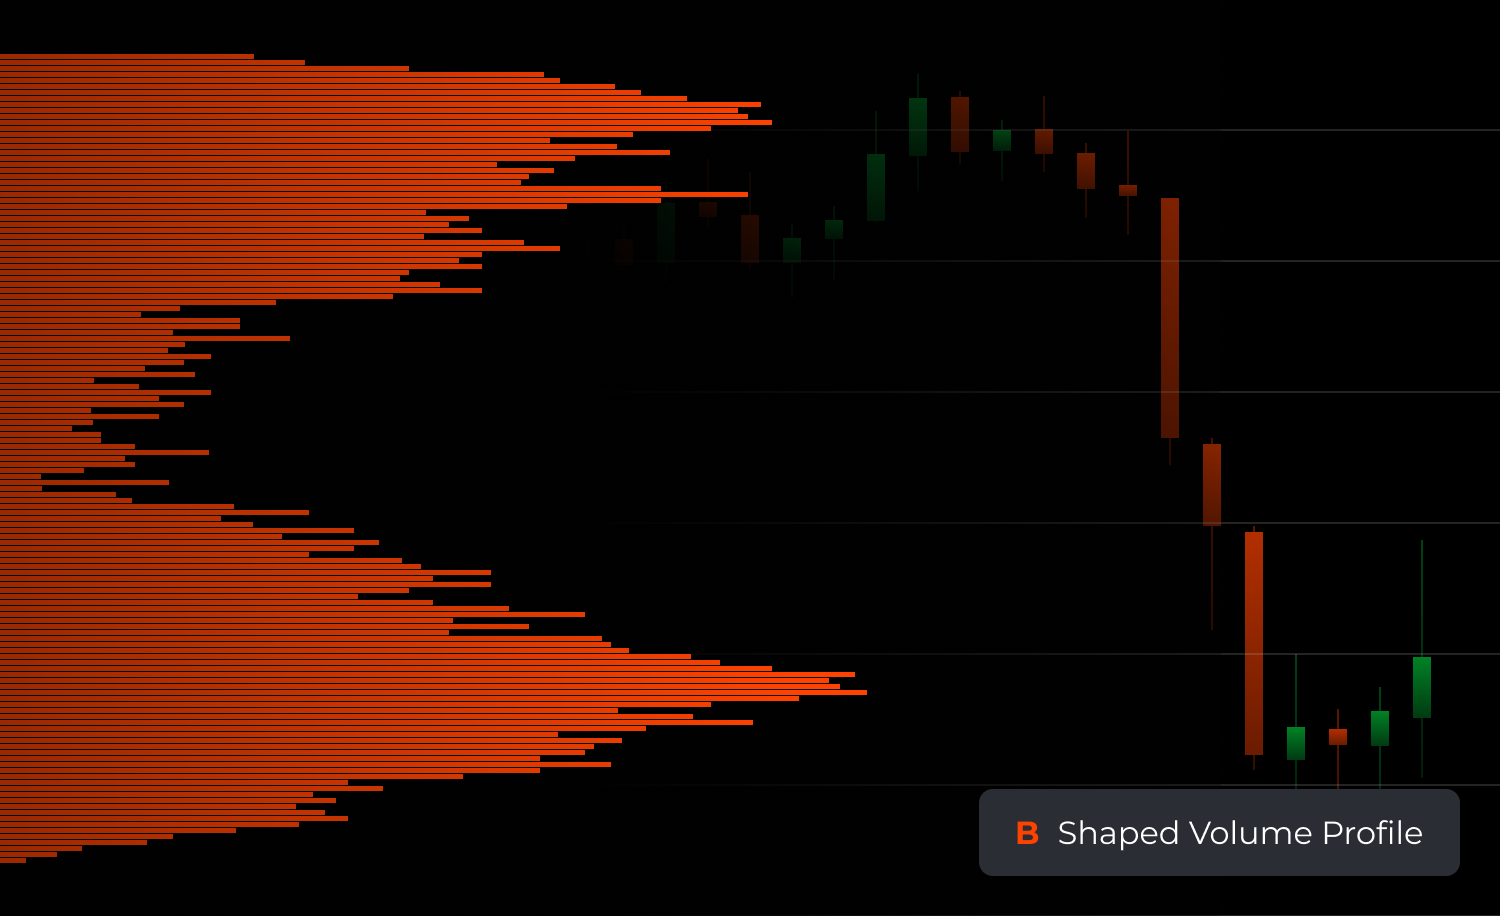
B-Shaped Volume Profile
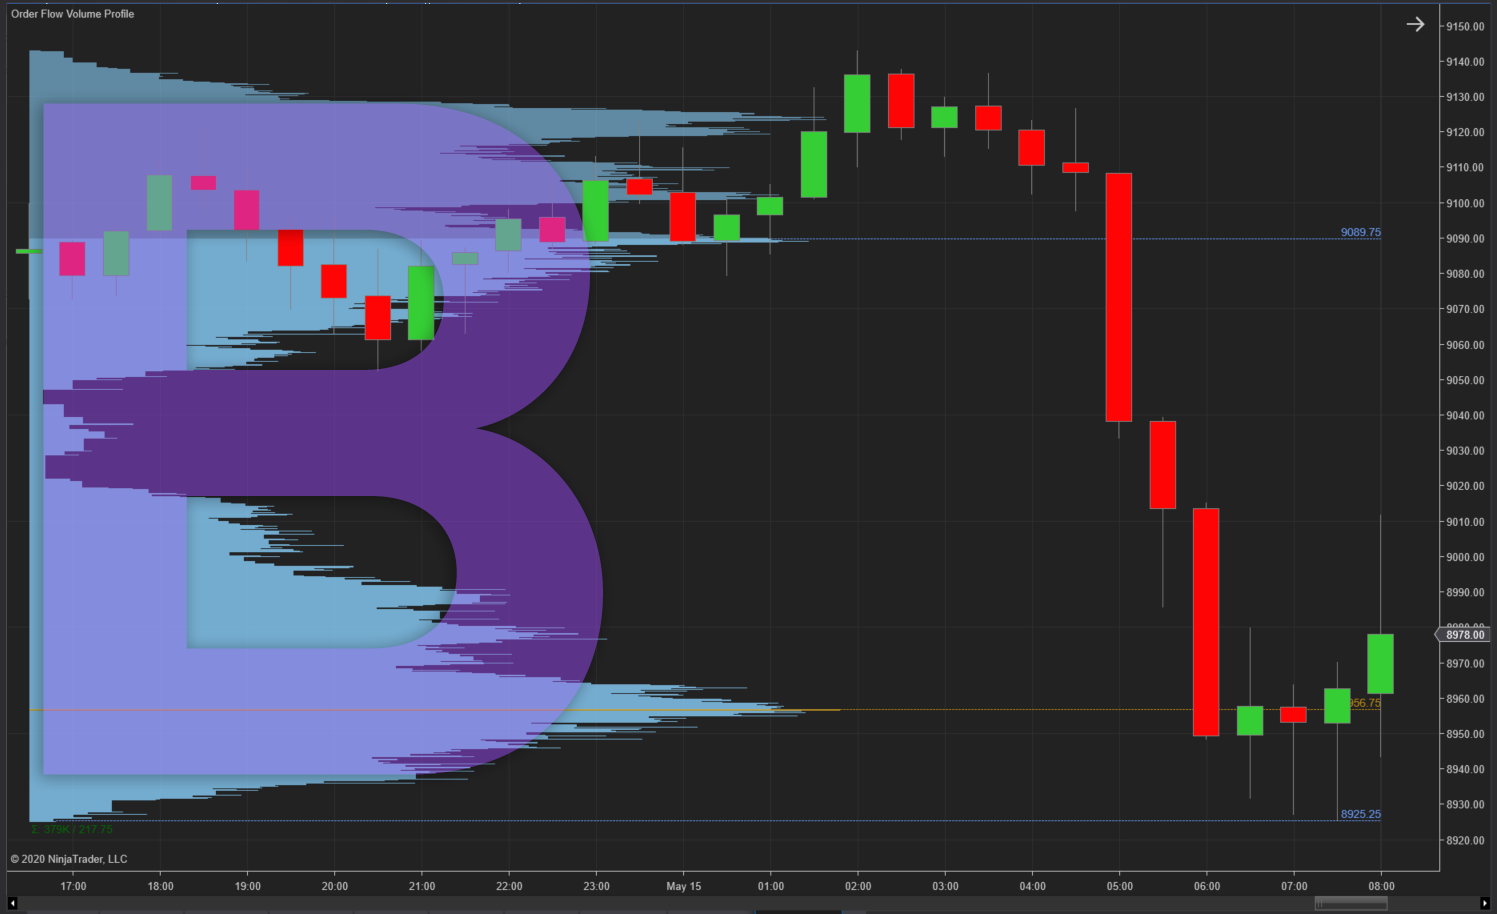
A B-shaped volume profile arises when two D-shaped profiles occur within a specified time period. Although there is only one value area and POC, some order flow traders will separate the profile into two separate "D-areas" with their own value areas. This is where NinjaTrader's Volume Profile Drawing Tool can come in handy, plotting custom profiles on the fly.
While B-shaped profiles are generally interpreted as a continuation of a trend, it is important to note which POC is more dominant, indicating whether activity was greatest at the top or bottom of the profile.

Start Using Volume Profile Today With NinjaTrader
Download the Platform FreeVolume profile is included with NinjaTrader's Order Flow+ suite of premium technical analysis tools. It features three profile modes and six display modes, and can be applied to charts as both an indicator and drawing tool.
NinjaTrader supports more than 2 million traders worldwide with a powerful and user-friendly trading platform, deep discount commissions, and world-class support. NinjaTrader is always free to use for advanced charting, strategy backtesting, and an immersive simulated (sim) trading experience.
Download NinjaTrader's trading platform and get started with a free trading demo today.
NinjaTrader Clearing, LLC ("NTC") is registered with the Commodity Futures Trading Commission (CFTC) as a futures commission merchant (FCM) and is a National Futures Association (NFA) member (NFA ID: 0309379). Volume profile analysis is part of NinjaTrader's Order Flow+ premium technical analysis suite, used by retail futures traders and CFTC-regulated brokerage clients to analyze CME Group equity index, energy, metals, and Treasury futures.
FAQs about volume profile shapes
Volume profile is a charting tool that displays the total trading volume executed at each individual price level across a selected time period, plotted horizontally on the price axis. Unlike a standard volume bar chart that shows volume per time interval, volume profile reveals where the market spent the most volume—exposing significant support, resistance, and value areas.
The four most common volume profile shapes are the D-shape (balance, with the POC in the middle), the P-shape (sharp rally followed by consolidation, generally bullish), the b-shape (sharp decline followed by consolidation, generally bearish), and the B-shape (two D-profiles stacked together, generally a trend continuation). Each shape signals a different market condition.
To read a volume profile, identify the POC (the price with the highest traded volume), the value area (typically 68% of total volume), and the high- and low-volume nodes. The widest section shows where the market accepted price; the narrow sections show where price was rejected. The overall shape—D, P, b, or B—reveals balance, exhaustion, or trend continuation.
A P-shaped volume profile is generally considered bullish—it forms after a sharp rally followed by consolidation, often reflecting short-covering pressure that signals strength continuing higher. A b-shaped volume profile is generally considered bearish—it forms after a sharp decline followed by consolidation, often reflecting long liquidation. Both shapes can also mark trend reversals when they appear against the prevailing direction.
