Coverage for the week of June 5th – June 9th: In this week’s coverage, we examine bullish trends in the Micro NASDAQ 100 and Canadian Dollar futures, and the weakening trends in Crude Oil and Gold futures. We also examine the economic report releases for the upcoming week.
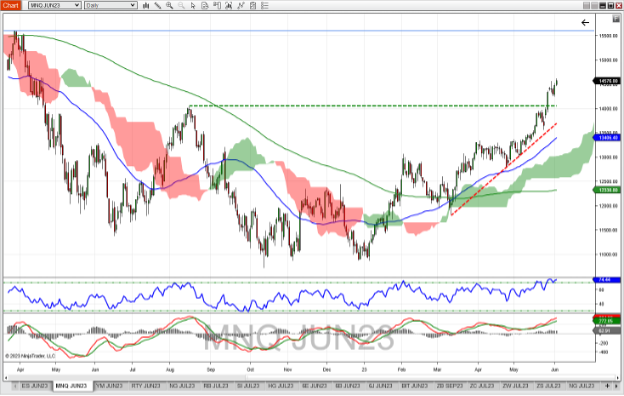
June Micro NASDAQ 100 Future Daily Chart
The June Micro NASDAQ 100 future continued the current uptrend that started at the beginning of the year. Price is well above 50- and 200-day moving averages; the Ichimoku cloud is not even a consideration as this bull trend continues. RSI is strong at 74.5, indicating an overbought state – though if the bull trend continues, RSI can stay overbought for a period. MACD also reflects a bullish trend as it is positive, as is the MACD histogram. The highs in April 2022 of 15617 could be the next upside target, while a turnaround could suggest support at the highs from August 2022 (14055).

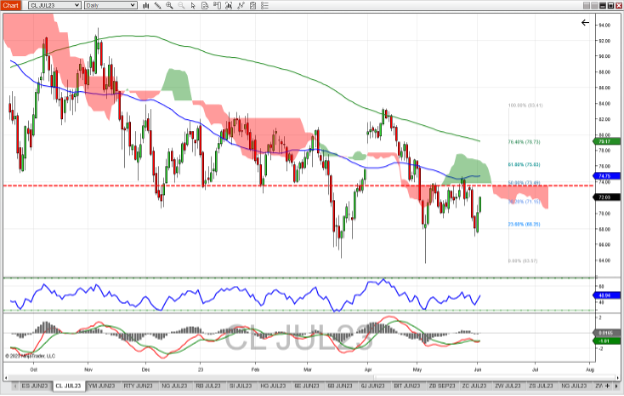
July Crude Oil Future Daily Chart
July Crude Oil futures could not break through the 73.50 level, which has acted as support and resistance going back to December 2022. This level coincides with the 50% Fibonacci level as defined by the downtrend that started in mid-April and finished in early May. Crude oil attempted a rally at the end of the week, with a bullish engulfing pattern occurring on Thursday. While oil is trading below the 50- and 200-day moving averages and the Ichimoku cloud (which is considered bearish), RSI is trending up, and MACD just crossed above its signal line, which is considered bullish. Should the rally continue, the bottom of the Ichimoku cloud (~74.00) could be resistance, while support might be found at the recent low of ~67.

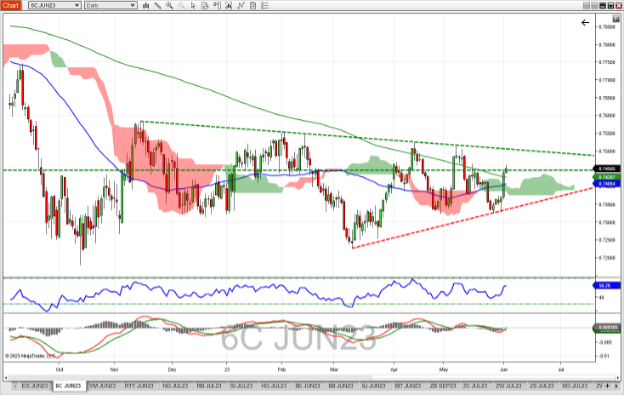
June Canadian Dollar Future Daily Chart
The June Canadian Dollar Future finished last week strong with a cross of the 50- and 200-day moving averages, and a breakthrough the Ichimoku cloud. It also broke above a support/resistance level of .7445, which has been evident since December of last year. MACD just crossed above its signal line (a bullish indication) while RSI is trending up-and at 58.50 has room to go to get to overbought status. Should this rally continue, resistance could occur at ~0.75020, as defined by the downward-sloping trend line found by connecting recent highs from February on. Various levels of support if the trend reverses back down, at the 200-day moving average (~0.74250) and next at the 50-day moving average (~0.7405).

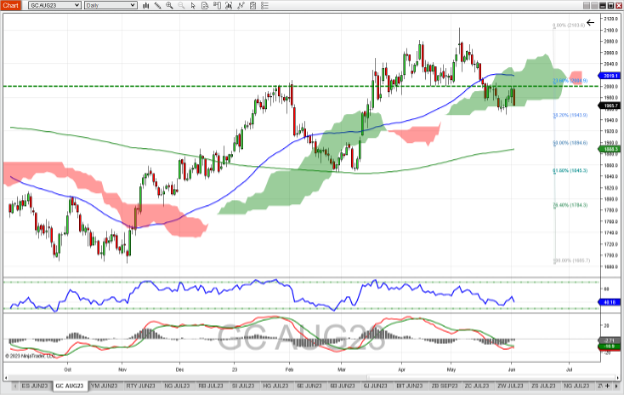
August Gold Future Daily Chart
The August Gold showed promising bullish signs last week, but failed to progress past the psychological level of 2000, with a collapse on Friday, which gave back almost the entirety of the week’s gains. Gold is now trading right at the bottom of the Ichimoku cloud – trading below this level is a bearish indication. This reversal is reflected in the RSI by a sharp turn down, and at 40 has room to continue to the oversold level of 30. MACD was poised for a bullish cross, but Friday’s pullback put that indication on hold. Should gold continue Friday’s trend, support might be found at 1943 (the 38% Fibonacci retracement of the uptrend from December 2022 to the recent high in early May). A resumption of the bullish trend might find resistance at 2000 as well as ~2018 (the 50-day moving average).

Economic Reports for the week of June 5th – June 9th
Commentary: This week is light on economic reports, with the regular weekly reports making up over half of the reports on this week’s schedule. Monday is unusual as PMI, ISM Manufacturing and Factory Orders arrive just after the stock market opens.
Tuesday’s sole report is the API Weekly Oil Stocks report, arriving after regular trading hours. Jobless claims on Thursday could be the most impactful report, arriving at 8:30 AM ET.
Friday is a big news day for agriculture traders as the Supply/Demand (WASDE) reports release at noon for Corn, Wheat, Cotton, Soybeans and other agricultural products. Ahead of the June 14th FOMC meeting, Fed speakers will be silent as they respect the Blackout period that started June 3rd and runs through June 15th.
|
Date |
Economic Reports |
|---|---|
|
Monday, June 5th |
9:45 AM ET: PMI Composite Final |
|
Tuesday, June 6th |
4:30 PM ET: API Weekly Oil Stocks @APIenergy |
|
Wednesday, June 7th |
7:00 AM ET: MBA Mortgage Applications |
|
Thursday, June 8th |
8:30 AM ET: Jobless Claims*** |
|
Friday, June 9th |
10:00 AM ET: Quarterly Services Survey |
***Market Moving Indicators
*Merit Extra Attention
Get Started with NinjaTrader
NinjaTrader supports more than 800,000 traders worldwide with a powerful and user-friendly trading platform, discount futures brokerage and world-class support. NinjaTrader is always free to use for advanced charting and strategy backtesting through an immersive trading simulator.
Download NinjaTrader’s award-winning trading platform and get started with a free trading demo with real-time market data today!

