Macro Moves in Focus: What's Shaping Markets Now?
Senior Economist Tracy Shuchart and Senior Market Strategist Jim Cagnina unpack the latest macro events shaking up global markets. Dive into our latest biweekly report to uncover the drivers behind recent market moves and position yourself ahead of what's next.
Metals
Gold Futures
Gold prices surged to an all-time high of $3,500 per ounce early in the week, driven by ongoing U.S.-China trade tensions, a weakening U.S. dollar (USD), and political uncertainty—including criticism of the Federal Reserve by President Trump. However, after Beijing announced exemptions on certain U.S. goods from tariffs, signaling a possible thaw in the trade dispute, gold prices fell sharply, dropping below $3,300 per ounce by the end of the week.
The easing of trade tensions reduced gold’s appeal as a safe-haven asset. Improved risk sentiment and hopes for positive developments in U.S.-China relations contributed to the pullback. At the same time, the USD strengthened and Treasury yields edged higher, further pressuring gold prices lower.
Central banks remained active, with the Swiss National Bank reporting significant profits from gold holdings and Kenya considering adding gold to its reserves for diversification.
Gold: Technical Overview
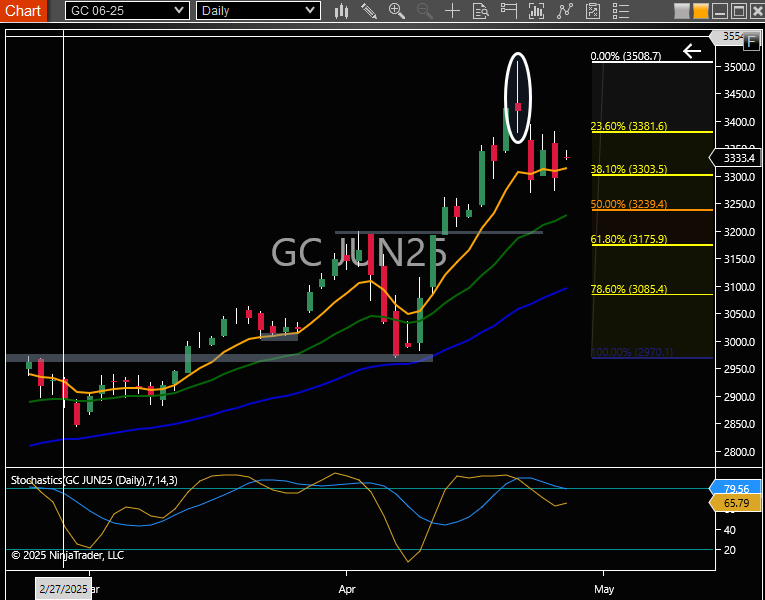
After an impressive run earlier this fiscal year, gold futures topped out at 3509.9 on Tuesday. However, the rally stopped dead in its tracks, as Tuesday’s candle closed with clear signs of a reversal.
The rest of the week saw gold trading between the 23.6% and 38.2% Fibonacci retracement levels, shedding nearly $200 from its highs. The 8 EMA is now active support at 3314, but Friday’s session closed with a bearish engulfing candle, highlighting growing downside pressure.
Key support sits at 3290, and if selling persists, a further move toward the 50% Fibonacci retracement and 21 EMA cluster around 3240 is possible.
Energy
Crude oil futures
Crude oil prices showed modest gains early in the week, with WTI crude rising to $61.84 per barrel and Brent crude reaching $65.20 by mid-April, both up less than 1%5. However, the market remained volatile, and by April 20–21, WTI futures had slipped to around $63 per barrel and Brent to $66.26, reflecting a 2-2.5% drop at the start of the new week.
Key Drivers
- US-Iran talks: Signs of progress in negotiations between the U.S. and Iran weighed on prices, as the potential for a renewed nuclear agreement could keep Iranian crude available in global markets, easing supply concerns.
- Tariff and Trade tensions: Ongoing concerns about global demand, driven by new U.S. tariffs and retaliatory measures from China, continued to dampen sentiment. The risk of tariffs curbing fuel demand remained a central theme, with traders adopting a cautious and defensive stance.
- Inventory and supply: Recent inventory reports showed significant drawdowns in refined products, partially supporting prices despite broader economic uncertainties. OPEC+ production adjustments and compensation plans also contributed to market caution, with traders watching for signs of compliance and potential supply increases.
Market Sentiment and Outlook
After weeks of high volatility, trading volumes have decreased, and price ranges have narrowed, indicating a consolidation phase as traders reassess fundamentals. Options markets showed increased demand for protective puts, highlighting continued defensive positioning.
Analyst forecasts for oil prices have been revised downward, with major institutions citing trade disputes and weaker demand from emerging markets as reasons for a more bearish outlook.
Crude Oil: Technical Overview
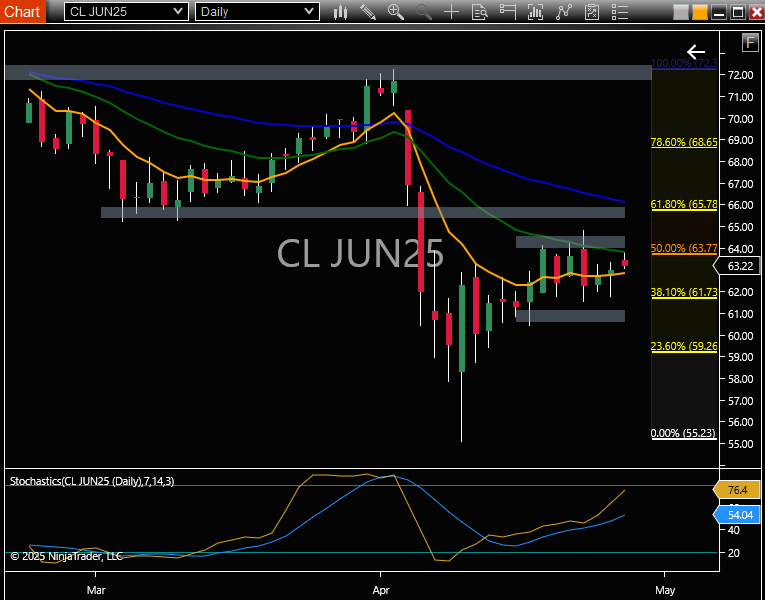
WTI light sweet crude oil is trading within a relatively tight consolidation band between 64.04 and 61.60, with the 8 EMA neatly centered in the middle of the range. The 50% Fibonacci retracement and the 21 EMA are converging around 63.77, reinforcing this zone as a key area of interest. The 8 and 21 EMAs are steadily tightening, reflecting the market's compression.
Meanwhile, stochastics are rapidly approaching overbought territory. Last week was marked by a series of small-range daily candles, highlighting the ongoing indecision.
Equities
Nasdaq Futures
Nasdaq-100 futures posted a strong rebound last week, surging to 6.7%—their best weekly performance since mid-April. This rally was driven by a broad recovery in technology stocks, particularly after Alphabet (Google’s parent) delivered a blowout earnings report that boosted optimism ahead of further major tech earnings.
Current Movement and Market Sentiment
As of Sunday evening (April 27), Nasdaq futures have slipped about 0.3% in pre-market trading. This pullback comes as investors brace for a busy week of first-quarter earnings, with major tech giants including Amazon, Apple, Meta Platforms, and Microsoft set to report their results.
The market is showing some caution after last week’s strong rally, with volatility heightened by lingering uncertainty over U.S. tariff policy and the potential impact on tech sector profits.
Drivers to Watch
The focus is squarely on tech earnings, with over 180 S&P 500 companies reporting, including four of the “Magnificent Seven.”
The market is also sensitive to any updates on U.S. trade policy and tariff announcements, which have contributed to recent volatility.
Micro Nasdaq Futures: Technical Overview
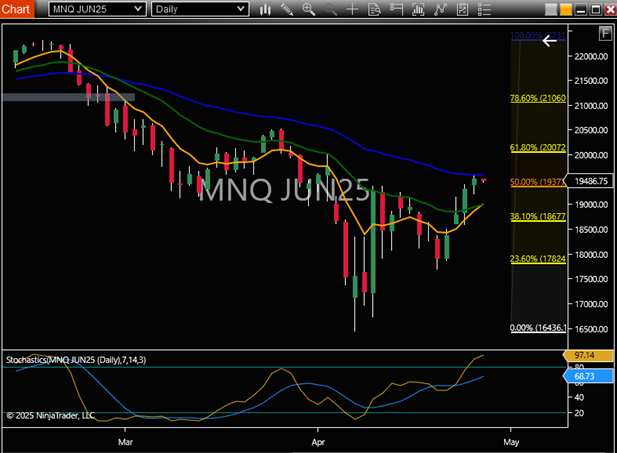
The Micro E-mini Nasdaq stock index futures delivered a strong performance last week, rallying for four consecutive sessions beginning on Tuesday. The index has now recovered 50% from the April 7 lows, finishing the week at 19,535.
Looking ahead, the 50-day EMA is framing the next resistance level at 19,591, with the 61.8% Fibonacci retracement up at 20,072 as the next major upside target. A bullish crossover is also taking shape, with the 8 EMA poised to cross above the 21 EMA, which could further energize the bulls.
On the downside, key support sits at the 38.2% Fibonacci retracement near 18,677.
Fixed Income
10-Year Treasury Futures
The 10-year Treasury yield started last week at 4.34% (Thursday, April 17) and ended at 4.29% on Friday, April 25.
The yield fluctuated within a narrow range, peaking at 4.42% on Monday, April 21 before easing lower throughout the week.
By Friday, the yield had declined slightly from Thursday’s 4.32% close, reflecting a modest move lower as investors weighed economic data and policy signals.
Key Drivers Last Week
The yield remained above its long-term average of 4.25%.
Market sentiment was influenced by ongoing discussions about Federal Reserve policy, inflation expectations, and mixed economic data releases.
The modest decline in yields later in the week suggests some investor demand for safety or positioning ahead of upcoming data and policy events.
What to Watch
- Fed policy and economic data: The market will be watching for any new signals from the Federal Reserve regarding interest rates and inflation. Important economic releases, such as employment and inflation data, could influence yield movements.
- Yield curve dynamics: The 10-year yield remains well above the 2-year (3.74%) but below the 30-year (4.74%), with the yield curve still being closely watched for signs of economic slowdown or recovery.
- Market volatility: Any surprises in economic data, changes in Fed tone, or geopolitical developments could prompt further volatility in Treasury yields.
10 Year U.S. Treasury Note: Technical Overview
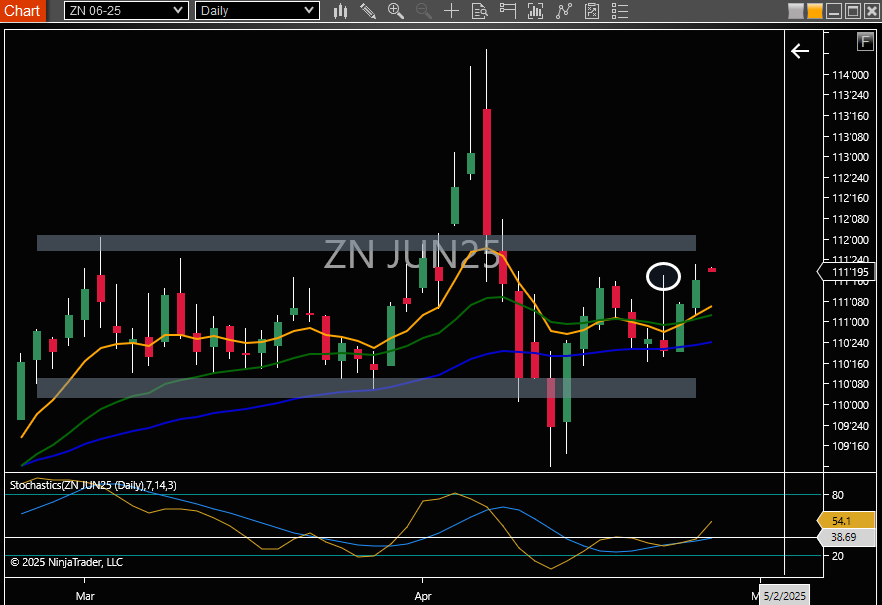
The 10-Year U.S. Treasury note continues to trade within a two-month consolidation range between 111'28 and 110'10, aside from brief, temporary price dislocations to both the upside and downside. The market has since rebalanced, with yields stabilizing around a comfortable 4.25%.
Last week, the market failed to close above the key 111'18 level, suggesting continued sideways price action in the near term. Meanwhile, stochastics have crossed higher from a neutral position, a technical development that could give the bulls a bit more confidence.

Trade Futures with NinjaTrader
Haven't signed up for your free NinjaTrader account yet? Get started today with a 14-day trial of live simulated futures trading.
