Renko charts offer a unique way to visualize market price action by focusing on movement rather than time. Built from blocks—or “bricks”—of a fixed size, Renko charts filter out market noise and can help clarify trend direction. For futures traders using this charting method, combining Renko charts with technical indicators can help strengthen decision-making and highlight key trading opportunities.
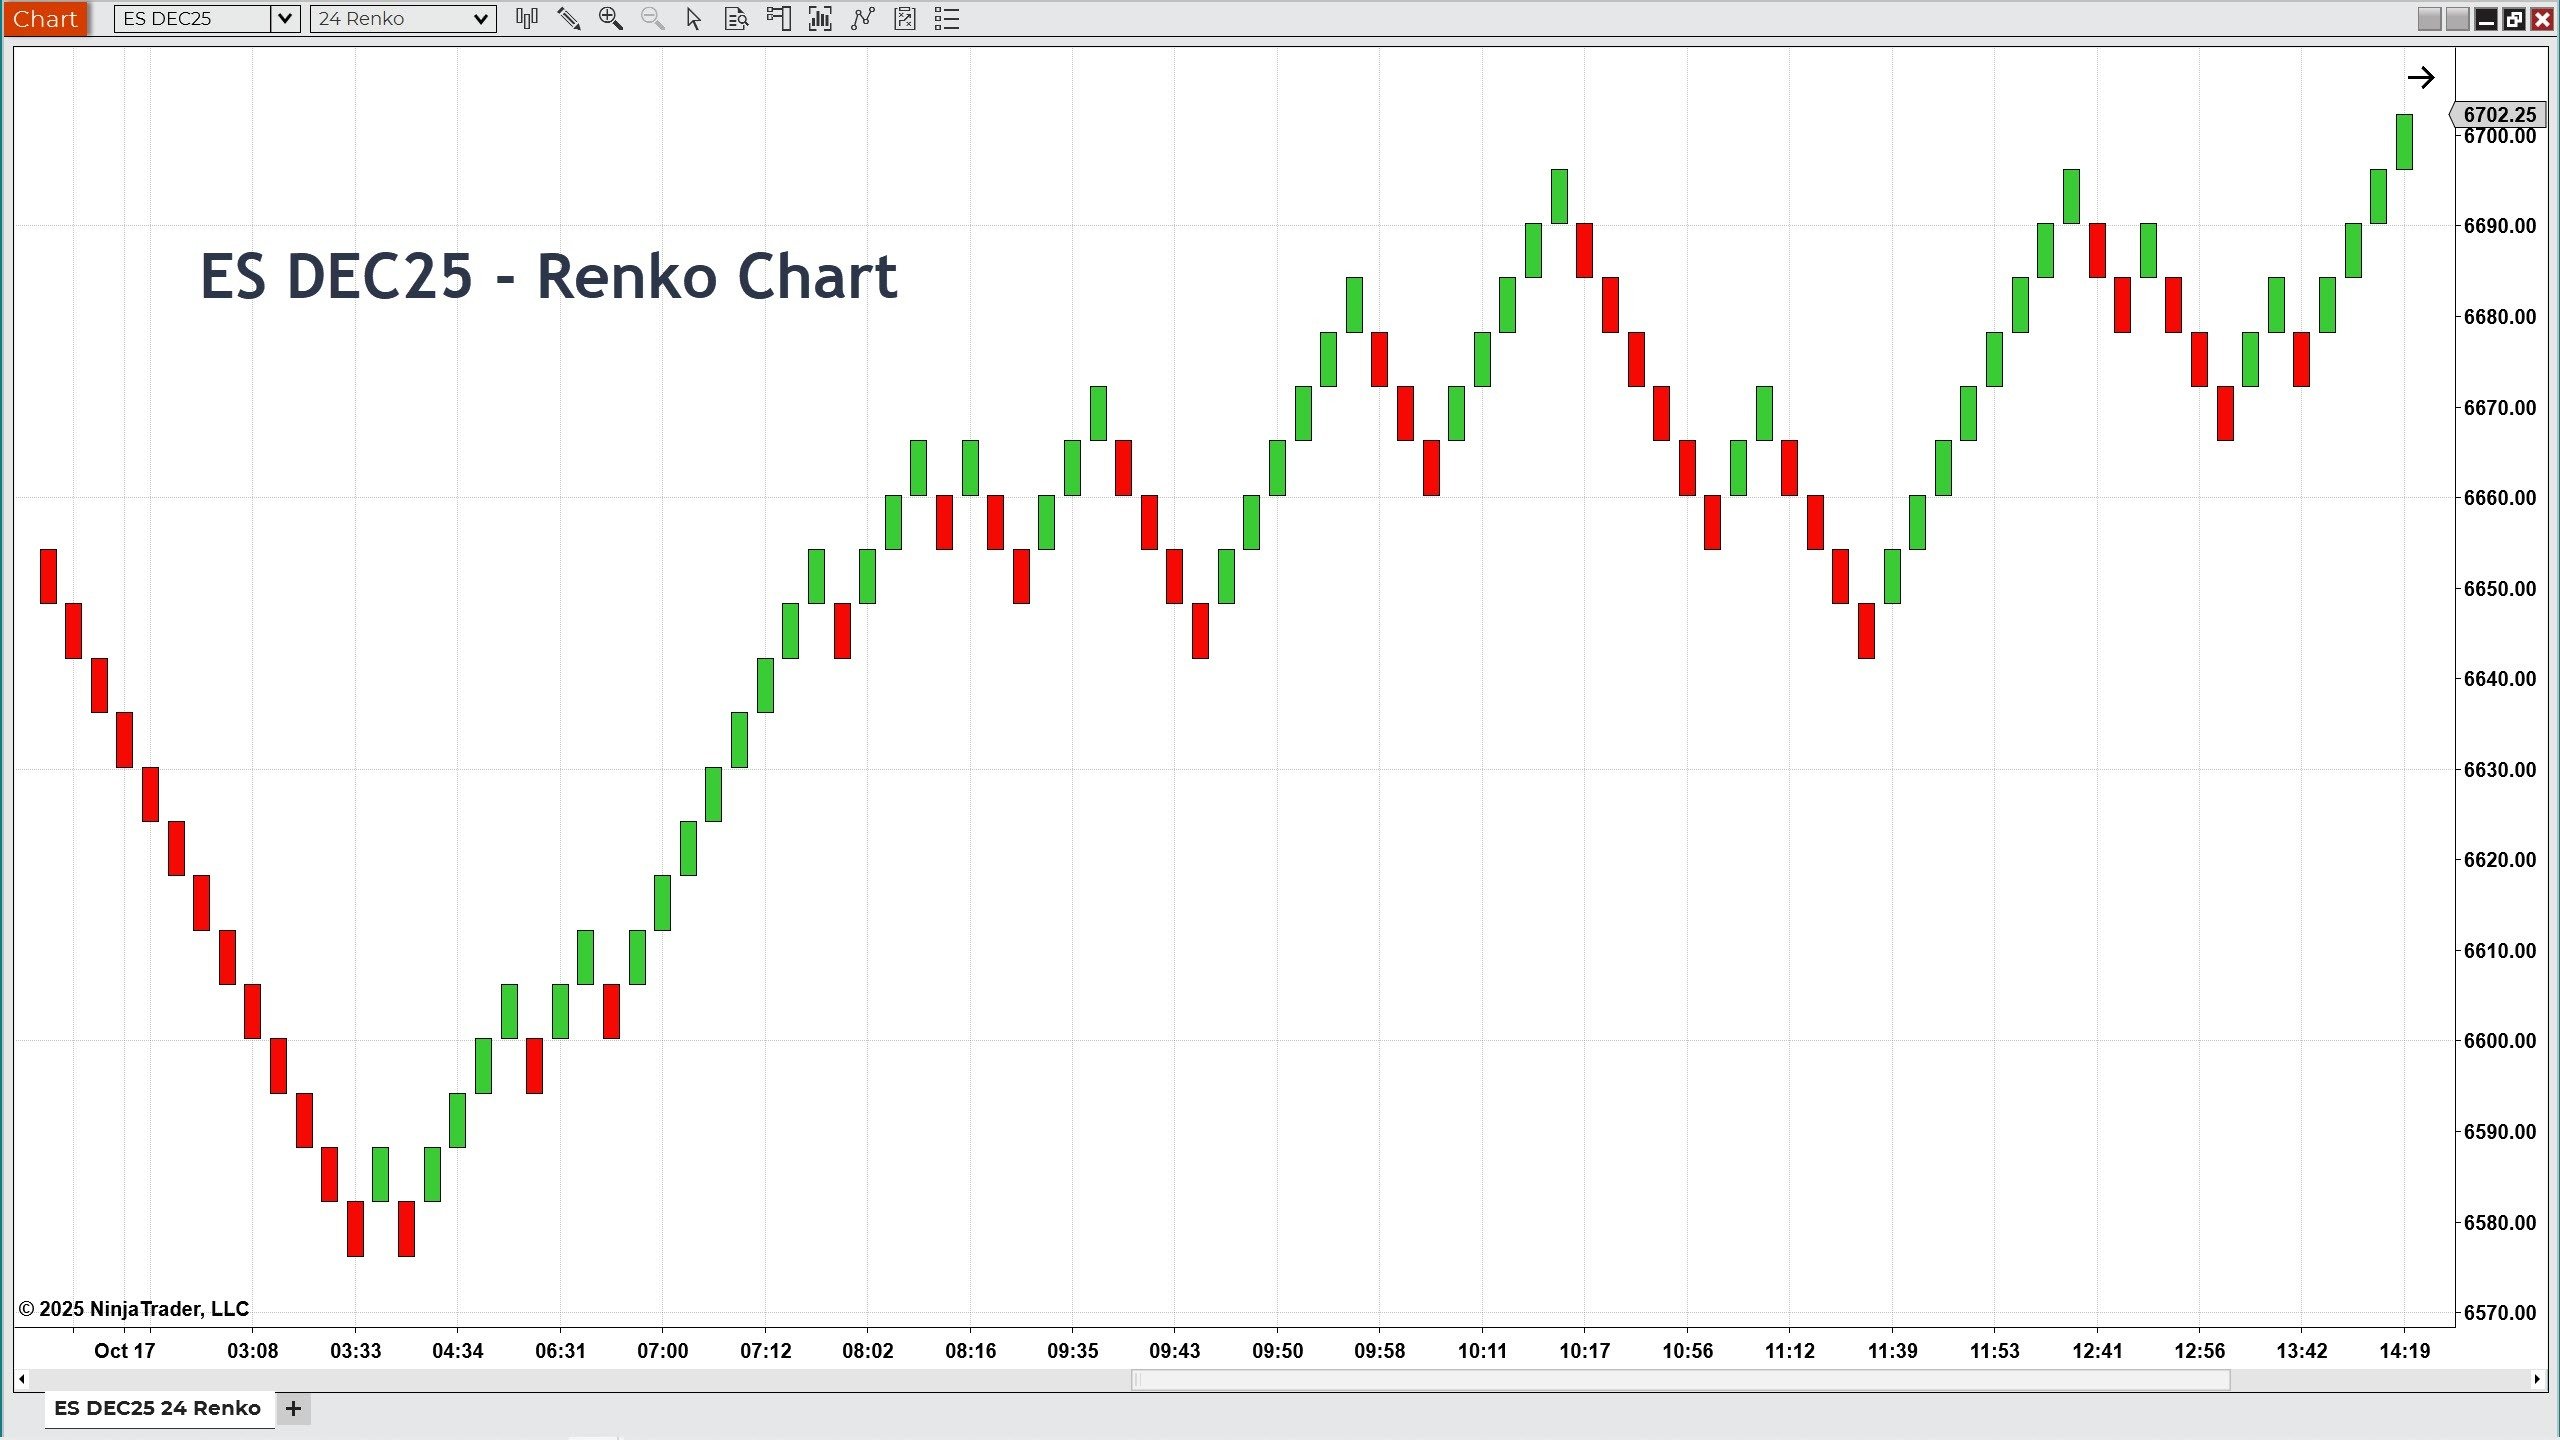 Figure 1: Renko chart displaying alternating green and red bricks that illustrate price movement and trend direction
Let’s look at some of the best indicators to pair with Renko charts in futures trading.
Why Renko charts appeal to futures traders
Renko charts can help simplify complex market movements. Unlike time-based charts that print a new candle at regular intervals, Renko charts only form a new brick when price moves a set number of ticks. This means there are more bars when the market is trending and fewer bars when the market is moving sideways.
This can help you:
- Emphasize trend direction by smoothing out price fluctuations
- Remove time-based market noise
- Create cleaner support/resistance levels
Because of this, many traders use Renko charts to confirm breakouts, identify reversals, and track trend strength. But on their own, Renko bricks don’t provide everything—that’s where futures indicators come in.
Moving averages: Supporting trend confirmation
Moving averages are some of the most popular futures indicators for Renko charts. Because Renko charts help highlight trends, moving averages can provide an extra layer of confirmation.
Popular moving average choices include:
- Simple moving average (SMA): Smooths price data over a fixed number of bricks to show general direction
- Exponential moving average (EMA): Reacts more quickly to recent price changes, which can be helpful when volatility increases
Moving averages respond much better to multiple Renko bars than a big price move in one or two large price bars. Many traders overlay one or more EMAs on their Renko charts to confirm the strength and direction of a trend or to signal a possible shift.
MACD: Spotting momentum shifts
Like moving averages, the moving average convergence/divergence (MACD) indicator is designed to track momentum and trend changes. On a Renko chart, MACD can be especially dynamic when price bricks start to trend, compress, or reverse. The MACD histogram works by comparing two EMAs and plotting both a MACD line and a signal line. When these lines cross or diverge, traders watch for potential:
- Entry or exit points
- Trend accelerations
- Reversals
With MACD, watch for the histogram to cross above and below 0 for directional Renko bar confirmation. Then, when the histogram starts to max out and turn over, along with a consolidation of the Renko bars, the trend may be ready to reverse.
Relative strength index: Monitoring overbought and oversold conditions
The relative strength index (RSI) is a momentum oscillator that measures the speed and change of price movements. While Renko charts filter out noise, RSI can help you identify whether a futures market may be overbought or oversold.
RSI values are typically plotted on a scale from 0 to 100:
- Readings above 70 may suggest overbought conditions.
- Readings below 30 may suggest oversold conditions.
Using the RSI in combination with Renko can help you spot early signs of price exhaustion or potential pullbacks—helpful information when evaluating trend strength.
Average true range: Setting brick size and managing risk
While not always used for trade signals, using average true range (ATR) is critical when working with Renko charts. ATR measures market volatility and can help determine the optimal brick size.
Using ATR to guide Renko settings can help you:
- Align the chart with current market conditions
- Avoid excessive noise during low-volatility periods
- Maintain clarity when volatility spikes
Some traders even adjust their Renko brick size dynamically based on ATR values over a recent period, allowing the chart to reflect current volatility levels.
Volume: Confirming breakout and trend strength
Volume isn’t typically displayed in Renko bricks but tracking it alongside price can add valuable context.
High volume during a breakout on a Renko chart may indicate strong conviction behind the move. Conversely, low volume may suggest a weaker signal.
Consider using:
- Volume histograms to spot spikes during price movement
- Volume profile to identify price levels where trading activity clusters
Adding volume analysis to your Renko setup can help you validate trade ideas and manage risk more effectively.
Combine indicators for a well-rounded strategy
While each of these indicators brings something to the futures trading table, combining them can offer deeper insights. For example:
- Use moving averages for trend confirmation.
- Add MACD or RSI to evaluate momentum and reversals.
- Reference ATR to set appropriate brick sizes and manage volatility.
- Track volume for additional context.
As always, you should thoroughly test any trading setup in a simulated environment before trading live. NinjaTrader’s free sim environment gives you a place to explore different Renko-based strategies using real-time futures market data.
Take your Renko charting to the next level with NinjaTrader
Renko charts offer a powerful way to simplify market analysis and focus on price movement. When paired with the right futures indicators, they can help highlight trends, spot reversals, and sharpen entry and exit decisions.
Whether you’re building a new strategy or refining an existing one, NinjaTrader provides the tools you need—from customizable charts and 100+ indicators to simulated trading with live market data.
Explore the world of Renko charts and technical indicators: Open your free NinjaTrader account today to learn more.
