What is a trend in futures trading?
Buy low, sell high – an adage so common that most people outside the financial world know exactly what it means. This is just another way to say, “take advantage of the upward trend.”
The trend is the general direction that a market is moving in over time. Ideally, a trader can take advantage of the observed trend to help make more successful trades. Futures traders have the added benefit of reversing that phrase to, “sell high, buy low,” when the trend is down.
Understanding and identifying what the current trend direction is, or if that trend is changing, can help you make better informed trading decisions.
Popular tools to identify and interpret trends in futures trading
Trendlines
The easiest way to identify a trend is to simply look at the chart. Using a trendline, you can connect data points to get a sense of what a trend looks like now, and where it could go if the trend continues.
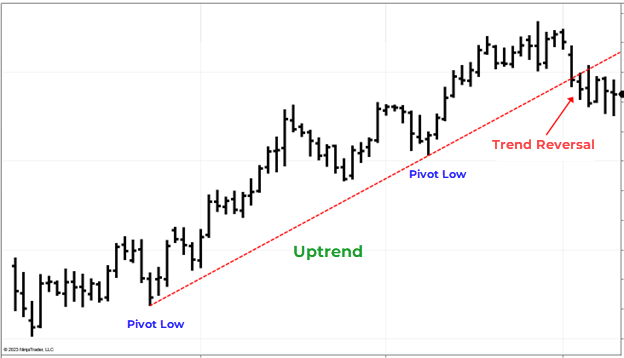
In an uptrend, create a trend line by connecting two pivot lows (a pivot low is the lowest low of several bars before and after that low). The trendline helps identify the trend support, and when prices cross or break that support line it can indicate a possible trend reversal.
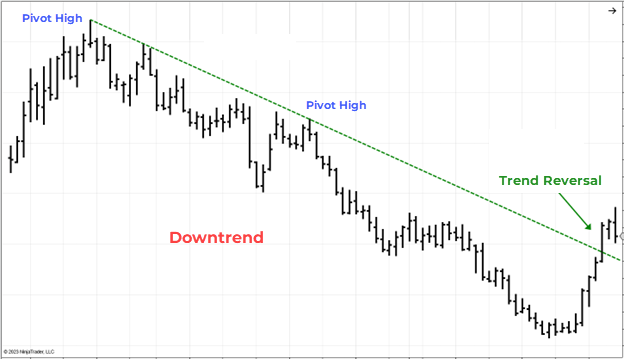
In a downtrend, connecting pivot highs to draw the trend line helps to identify the downtrend resistance, and if prices break above this line, it could indicate that the downtrend could be reversing.
Moving average
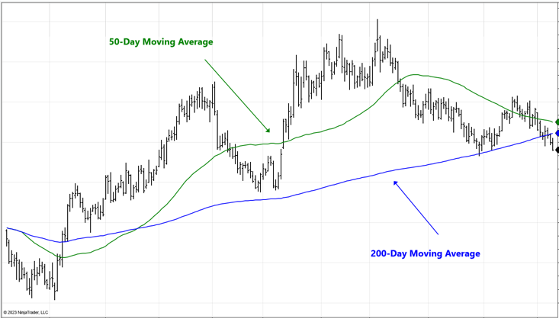
The most common indicators in technical analysis, the moving average plots the data point for a set number of bars to provide a normalization of data points making it easier to identify an overall trend.
It is considered “moving” because as each new bar is built in real time, the oldest data point falls out of the calculation, and the updated average is added to the new bar.
Common lookback values for the moving average calculation on daily charts are 50, 100, and 200. Intraday charts tend to use smaller average periods like 5, 10, and 20.
A trader can use moving averages in several ways to help make trading decisions:
Trend identification
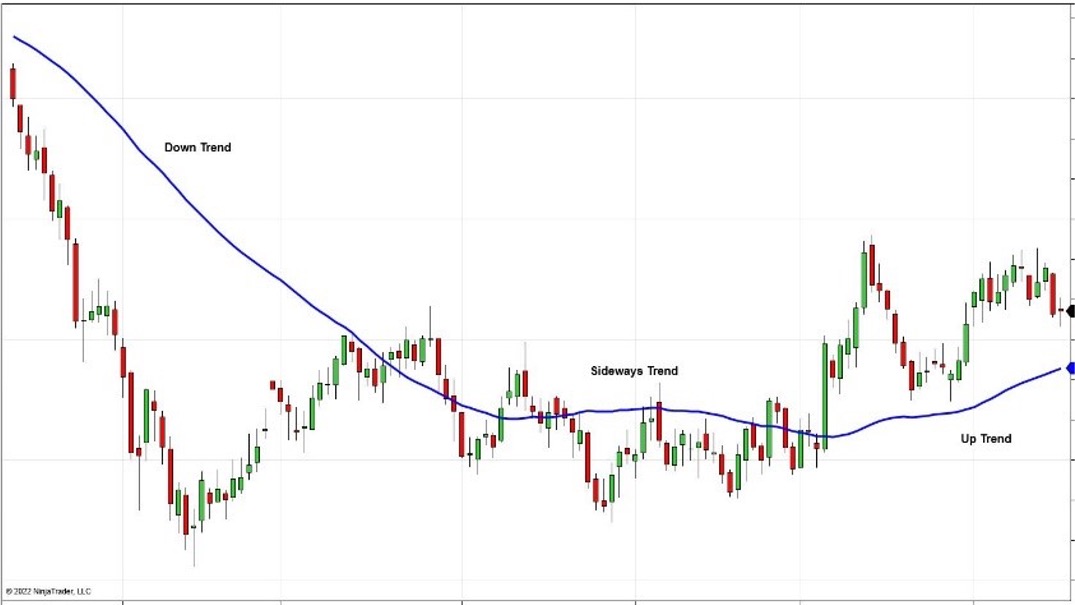
A moving average provides two powerful visual methods for identifying the current trend direction and market sentiment.
One of the best ways to determine the current trend direction is by simply looking at the slope of a moving average. An upslope is bullish and a downslope is bearish. By adjusting the lookback length of the moving average, traders can better identify trends over different timeframes.
Another quick way to determine market sentiment is by simply looking at the price bars:
- Bullish bias = if bars are above a moving average
- Bearish bias = if bars are below a moving average
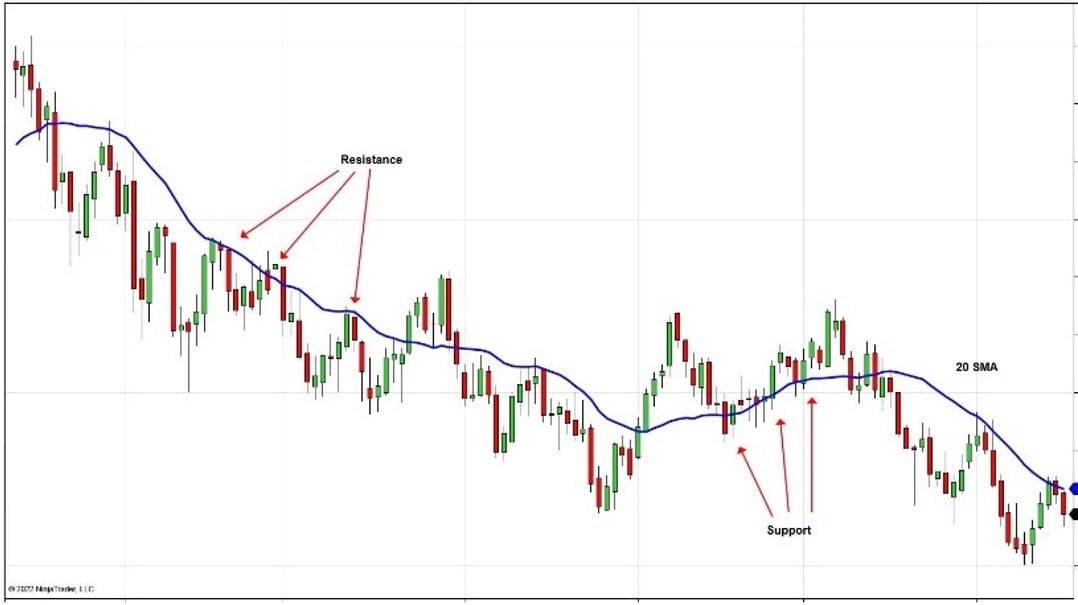
Support and resistance
The moving average lines often act as support and resistance levels as prices come into proximity of the lines.
A moving average can be used to identify possible support or resistance. As price nears the moving average from above, the moving average acts as support, with the expectation that price might have difficulty continuing through the moving average. Likewise, as price approaches a moving average from below, the moving average can act as resistance.
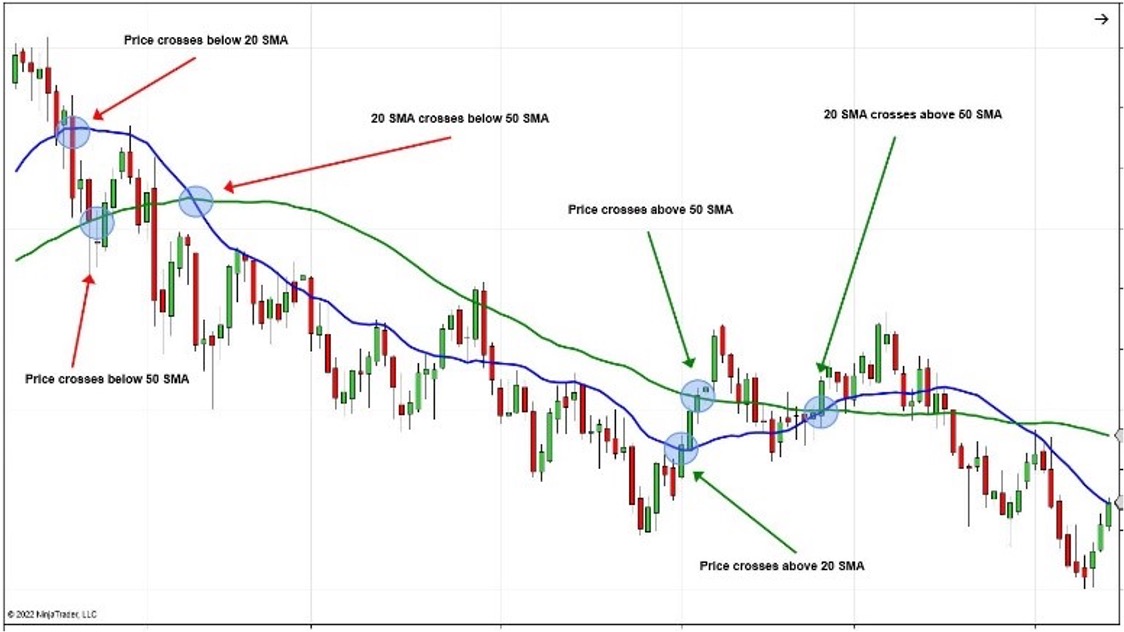
Crossing moving averages
Price crossing through a moving average can indicate that a trend is changing.
When the bar closing price crosses above a moving average, that is a bullish indication, and crossing below is a bearish indication.
When a shorter-term moving average crosses above a longer-term, a bullish trend is possible, and a bearish trend is indicated by a shorter-term crossing below the longer-term moving average.

Technical Analysis Made Easy
Build your futures trading foundation using technical analysis to identify trends, support and resistance, and key chart patterns.
Trend direction and strength
The directional movement indicator (DMI) and average directional index (ADX) are indicators used to help determine trend direction and trend strength.
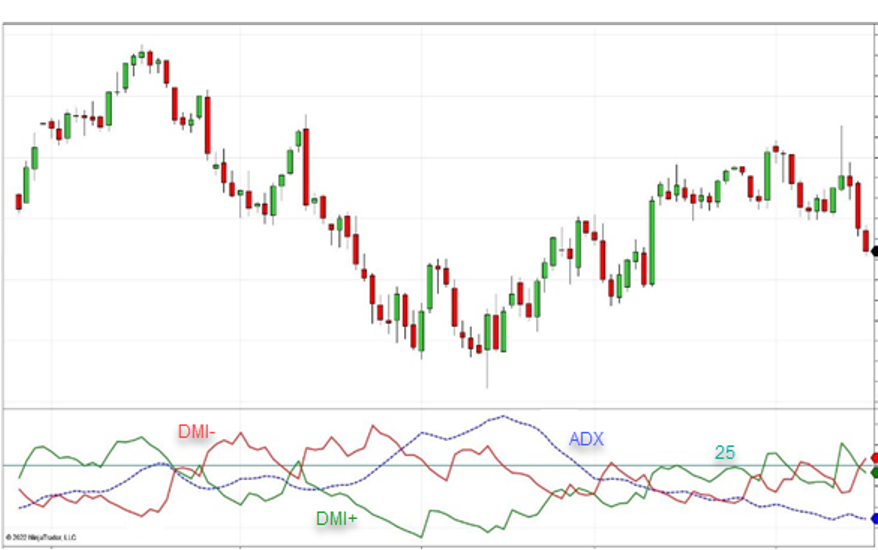
The DMI compares the change in highs and lows from bar to bar to determine whether a bar’s move is more positive or negative. This results in two lines, the DI Plus and DI Minus lines, usually shown as green and red lines:
- If the DI+ line is greater than the DI- line, the trend is bullish
- I the DI- line is greater than the D+ line, the trend is bearish
- A bearish trend is indicated by the DI- line being above the DI+ line.
- When the two lines cross, a trend change could be in play.
The ADX is a derivative of the DMI calculation and is used to measure trend strength. It is generally accepted that a value of 25 or below indicates no trend, while values above 25 indicate a trend is in place.
The higher the value above 25, the stronger the trend. Traders watch when the ADX level crosses above or below 25.

Learn how to trade futures with industry pros
Join veteran futures trader Anthony Crudele, Senior Economist Tracy Shuchart, and Senior Market Strategist Jim Cagnina as they bridge macro insights with technical precision to uncover trading opportunities in real time.
Get expert analysis, live trade execution, and actionable insights—all in one place. Find your futures trading edge by tuning in to NinjaTrader Live.
Join us weekdays: 8:00 am – 12:00 pm ET | 2:30 pm – 4:00 pm ET (no livestream Friday afternoons) Sundays: 5:45 pm - 6:45 pm ET

Practice trend analysis on futures trading charts
Understanding how the market is trending is a foundational concept that aspiring futures traders should practice. This introduction helps to open the door to the wider universe of technical analysis tools available to measure market behavior.
Get started on your trading journey with NinjaTrader’s free futures charts and simulated trading powered by real-time futures market data. Practice chart building, explore the available technical analysis tools and trade in a risk-free simulation environment until you are ready for the live markets.