Using Historical Market Data To Uncover An Edge In Technical Trading Patterns
The futures markets are a dynamic environment where price movements can be difficult to predict with any certainty or consistency. Trying to guess where the markets will go next is not a viable long-term trading plan. However, as technical trading patterns form, traders can analyze how certain setups have performed over time and measure the recurring opportunities and probabilities by applying a statistical approach using historical market data.
This approach allows for a more objective way to build a trading plan with realistic performance expectations. To evaluate a pattern’s statistical success rate, we can look back at historical data to find each instance of the pattern and then measure what happens next. This should be done for each unique pattern and symbol as no two futures symbols behave the same way.
Finding High-Probability Setups With Historical Data
Historical data can support every type of trader—those who trade using price action, indicators, or volume. We’ve pulled three reports from Edgeful.com to show you how past trends and technical trading patterns can help you find high-probability setups. Edgeful is an online technical analysis solution that breaks down market data and trade setups into easy-to-read reports that traders can use to help identify high-probability trades.
Price Action Report
Let’s start with a price action report, focusing on E-Mini Nasdaq 100 index futures (NQ) for 08/07/24 – 02/06/25 (six-month period).
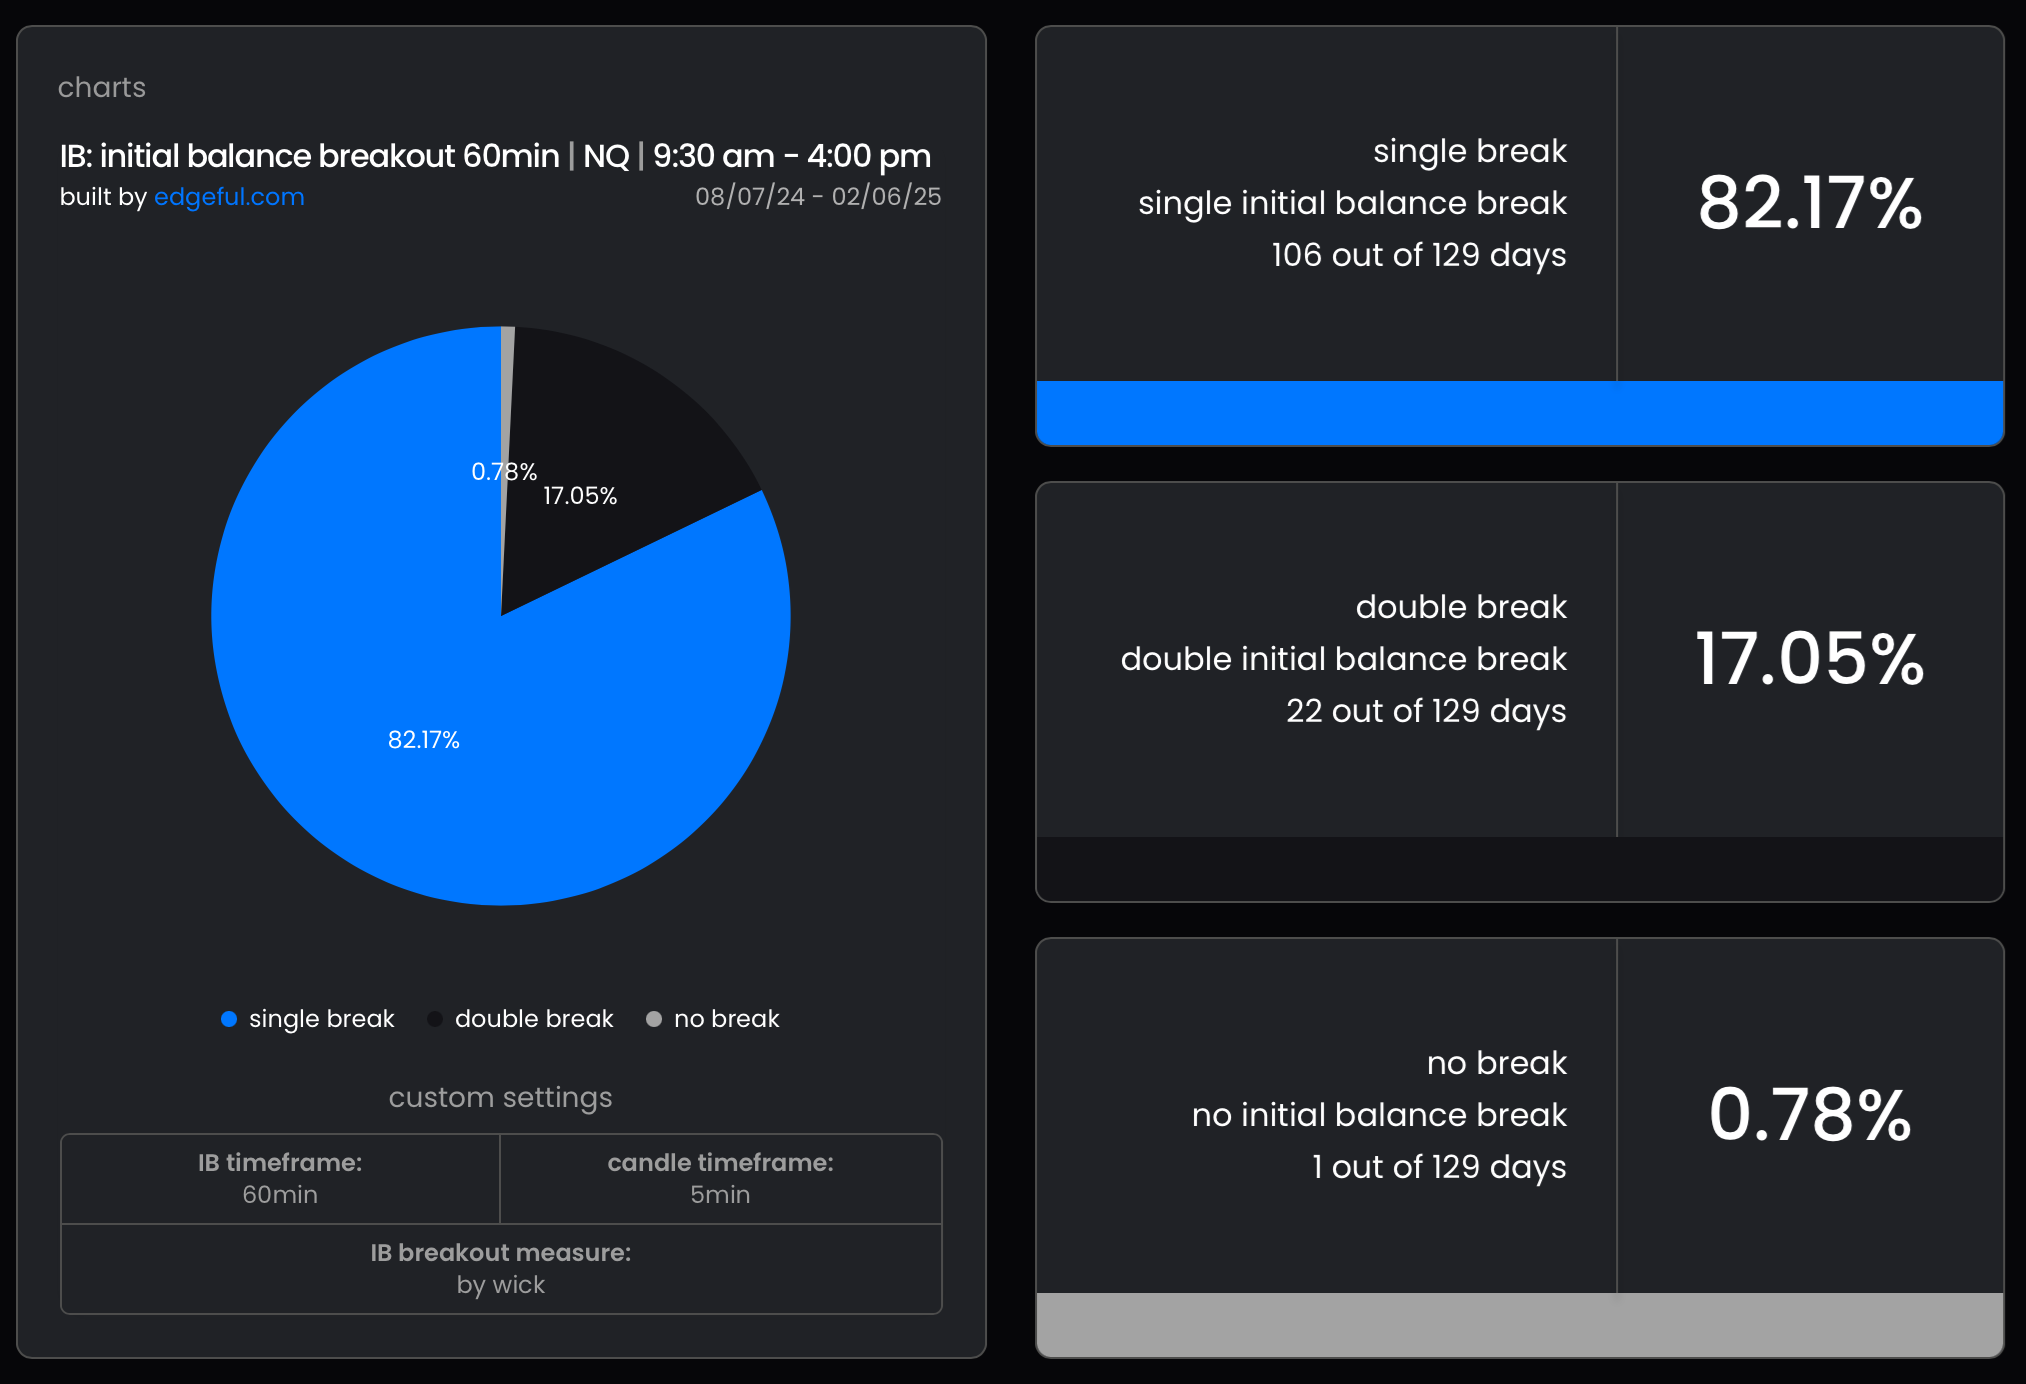 Figure 1: 60-minute initial balance breakdown report on NQ, New York session
The initial balance (IB) is simply the high and low of the first hour of the session (9:30 am – 10:30 am ET). There are three possible outcomes: a single break of the IB, a double break, and no break. As you can see, the single break data is the strongest at 82.17%.
How can you use this? One way is to target one side of the IB to be broken; then once it breaks, have a bias in that direction, not expecting a double break on the day.
Indicator Report
Next, let’s dive into an indicator report, looking at technical trading patterns for E-mini Dow Jones futures (YM) for 08/09/24 – 02/06/25 (six-month period). 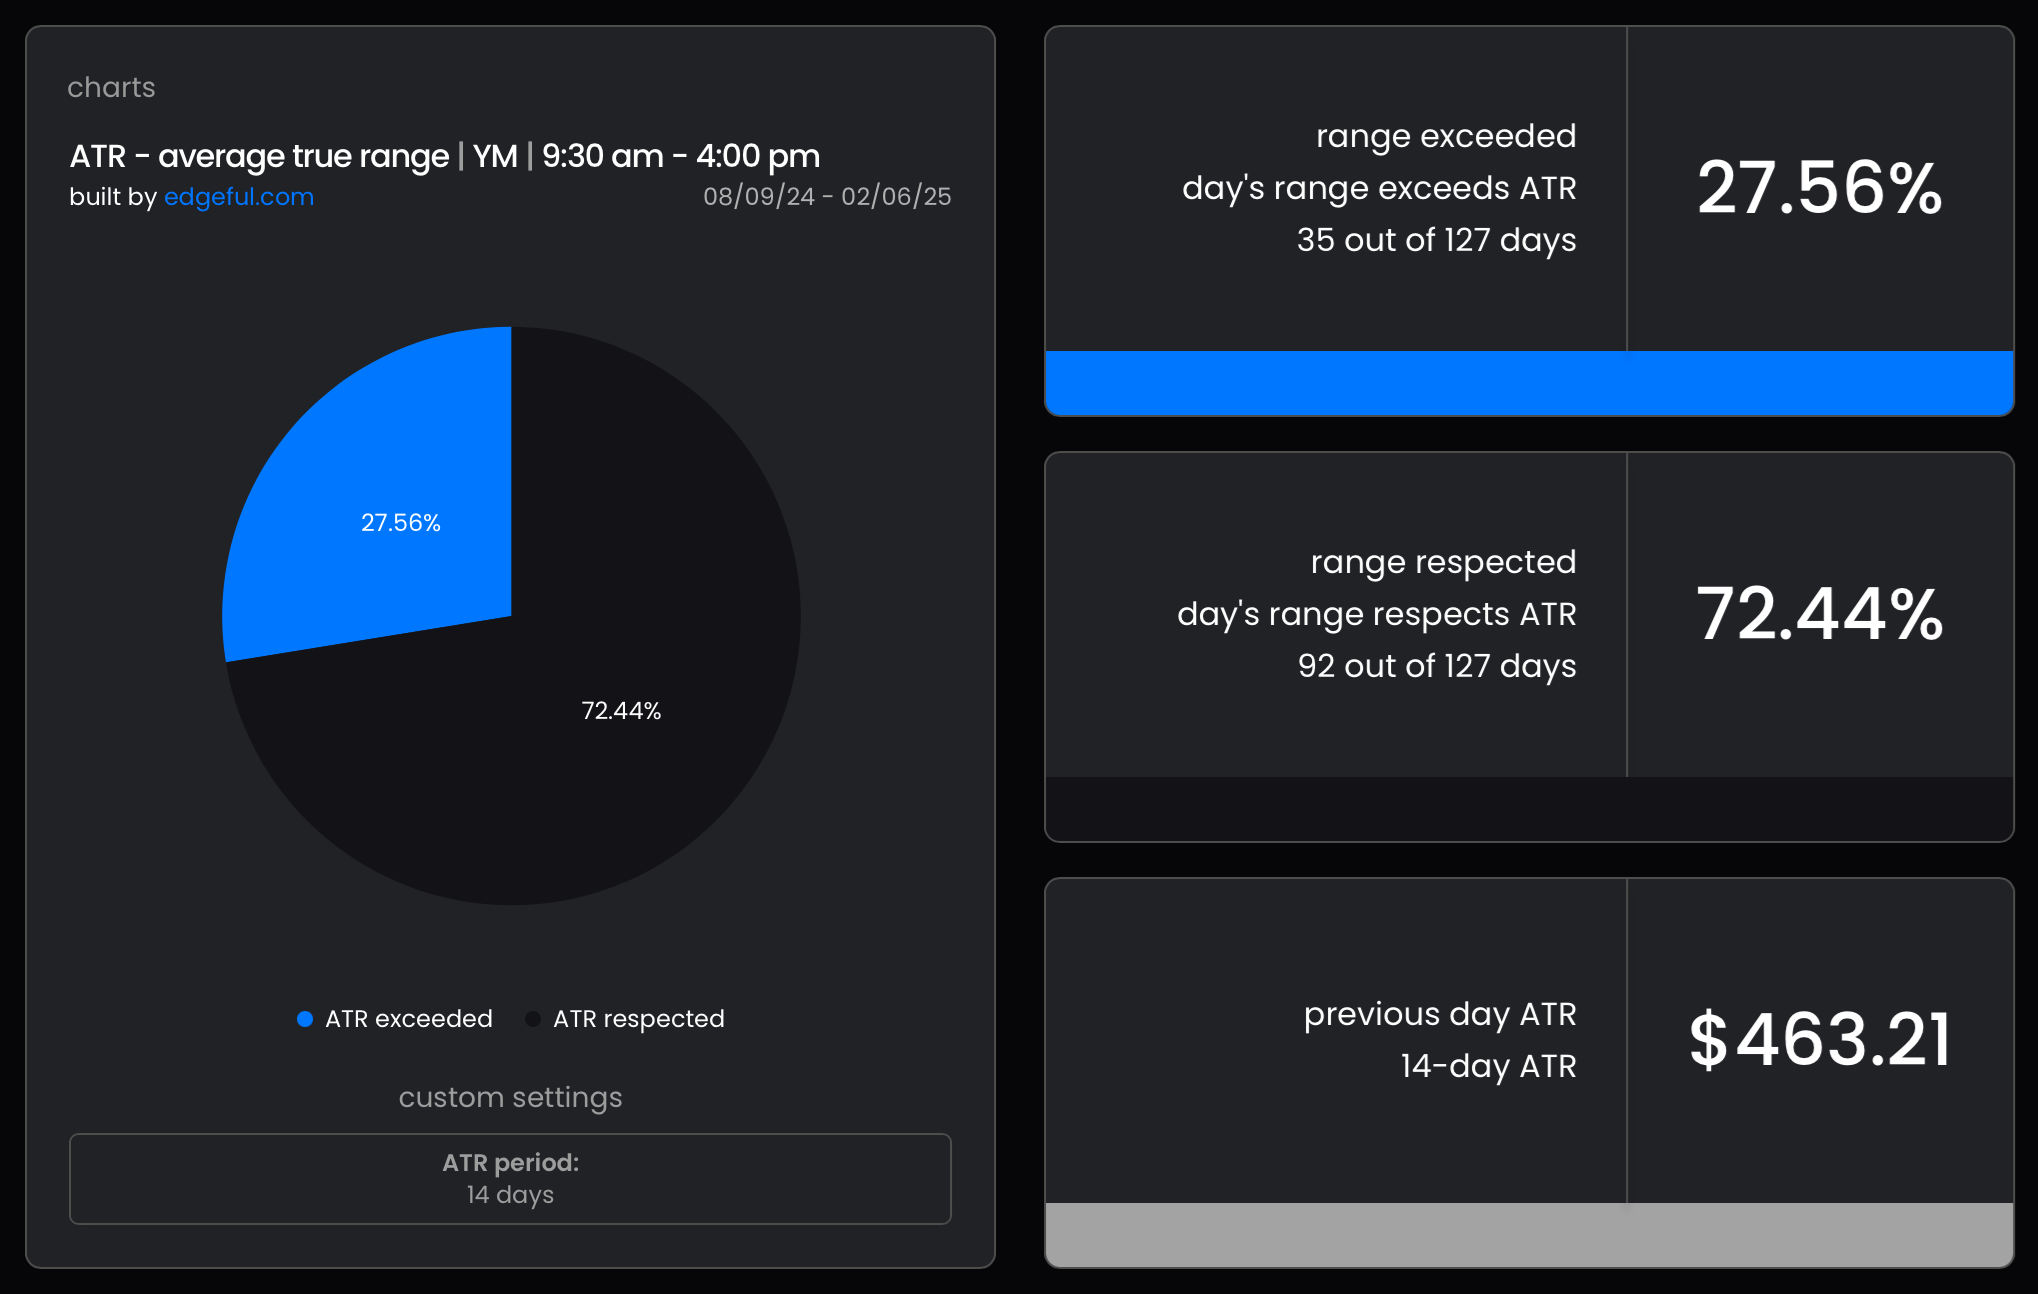 Figure 2: Average true range on YM, New York session
The average true range (ATR) report tells you how often price will exceed or respect the daily ATR. If the ATR is $100, it will tell you how often today’s range will be less than or greater than $100.
You can see here for YM in the last six months, the range has respected the daily ATR 72.44%
of the time. There are two main ways you can use this: taking profit and catching reversals.
You always want to set your targets in high-probability areas. If there’s over a 72% chance
that price is not going to exceed the daily ATR, then you maximize profits and set targets within the ATR.
On the other hand, if you want to catch a reversal, you can start to enter that trade as price starts to fill the majority of ATR, expecting price to reverse and not exceed it. ATR is a great guardrail for today’s range—and some days exceed it, but most days do not.
Volume Report
Let’s look at a volume report, focusing on E-mini S&P 500 futures (ES) for 02/07/24 – 02/06/25 (one-year period). 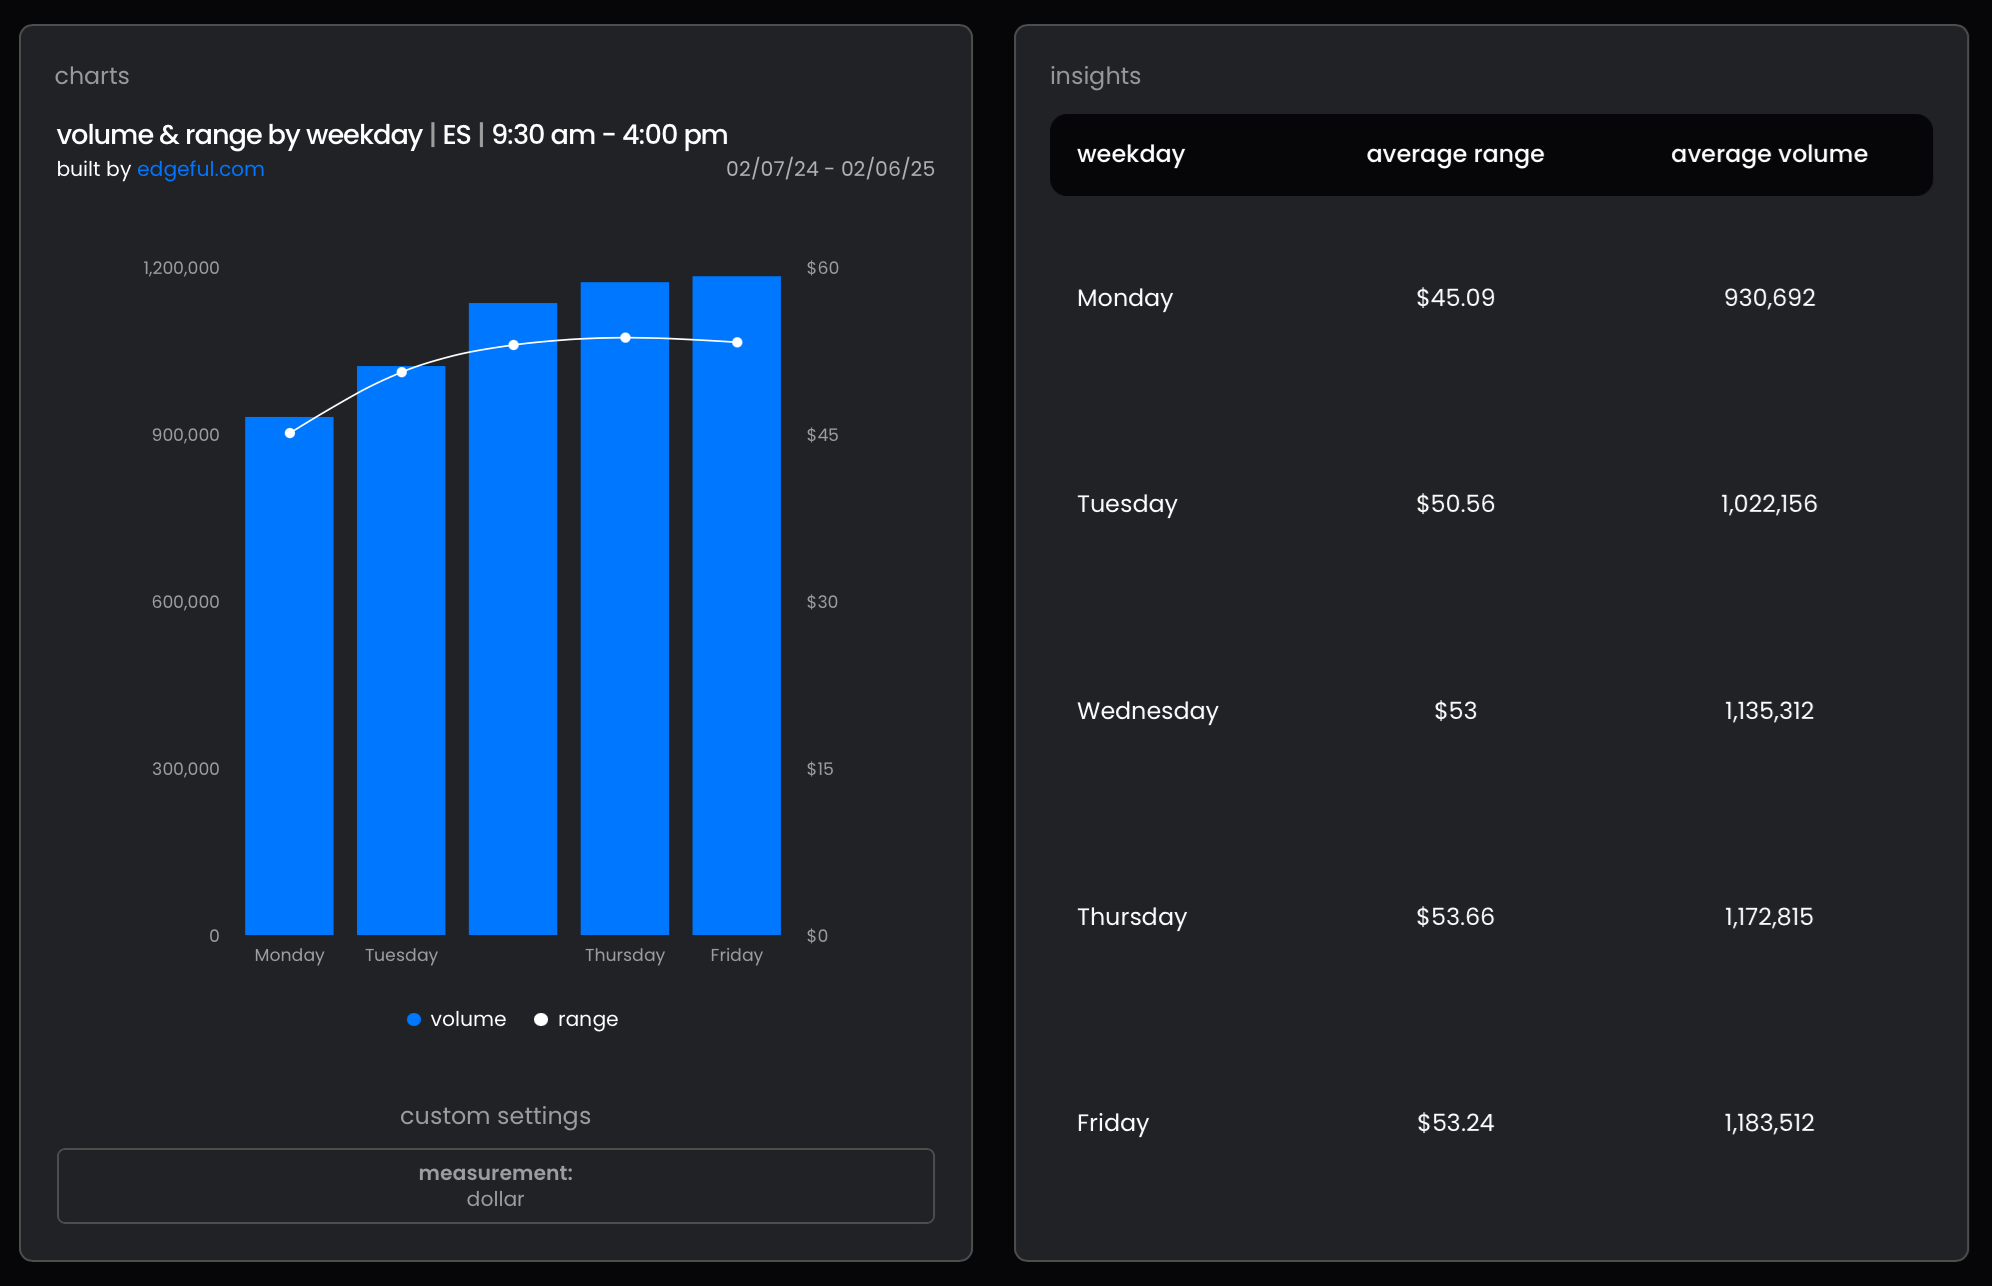 Figure 3: Volume and range by weekday on ES, New York session
If you trade the same ticker every day, it doesn’t mean it will behave the same every day. The volume and range report on Edgeful shows the average volume and range by weekday so you can understand the market environment on a daily basis.
This report will give you a strong understanding of whether the day you’re trading typically has high or low volume and range. Low volume is correlated with smaller ranges, which results in choppy price action; it’s typically difficult to be profitable on choppy days with a ton of fake outs. However, if you focus on trading on days with higher volume and range, you’ll typically see cleaner moves with more continuation and less fake outs.
The three reports above give you a glimpse of how analyzing historical data can reveal weekday trends and technical trading patterns for the tickers on your watchlist. Having these insights can help you spot high-probability setups and build trading strategies with the odds in your favor. But before you do that, there’s one last piece of this equation we need to go over: time.
Data Analysis And Time: Less Is More
In the context of data analysis, time can be your best friend or your worst enemy. It’s easy to think that the longer you look back, the better idea you’ll have of market behaviors, because you’re aggregating as much information as possible. But in this case, less is really more.
If you’re a trader, you want to understand the current market environment and how prices are moving now. Looking back at 20 years of data may be useful to an investor but not to traders looking to set entries and exits today. We recommend looking back no more than one year to get a feel for the current market environment.
Do not dilute your data with what happened decades ago. Focus on what’s happening right now and keep up with the most recent updates. The data is quick to change, and you’ve got to be ready to adapt. Trends and technical trading patterns from last year may not apply today, as you’ll see in the examples below.
Why You Should Rerun Your Statistical Analysis
Market price action and behavior can change over time. Increasing or decreasing volatility, large price swings, and changing fundamentals can all affect the performance of a pattern. That’s why it’s important to consistently rerun the statistical analysis for the markets you’re trading. It’s also a good idea to run your analysis of the most recent historical data, as price action two or more years ago may not necessarily be relevant to what’s happening in the market now.
This report looks at ES’s price action to determine how often price tends to break out, break down, or double break in the 15-minute opening range. Here’s the comparison between Q1 of 2024 and Q4 of 2024:
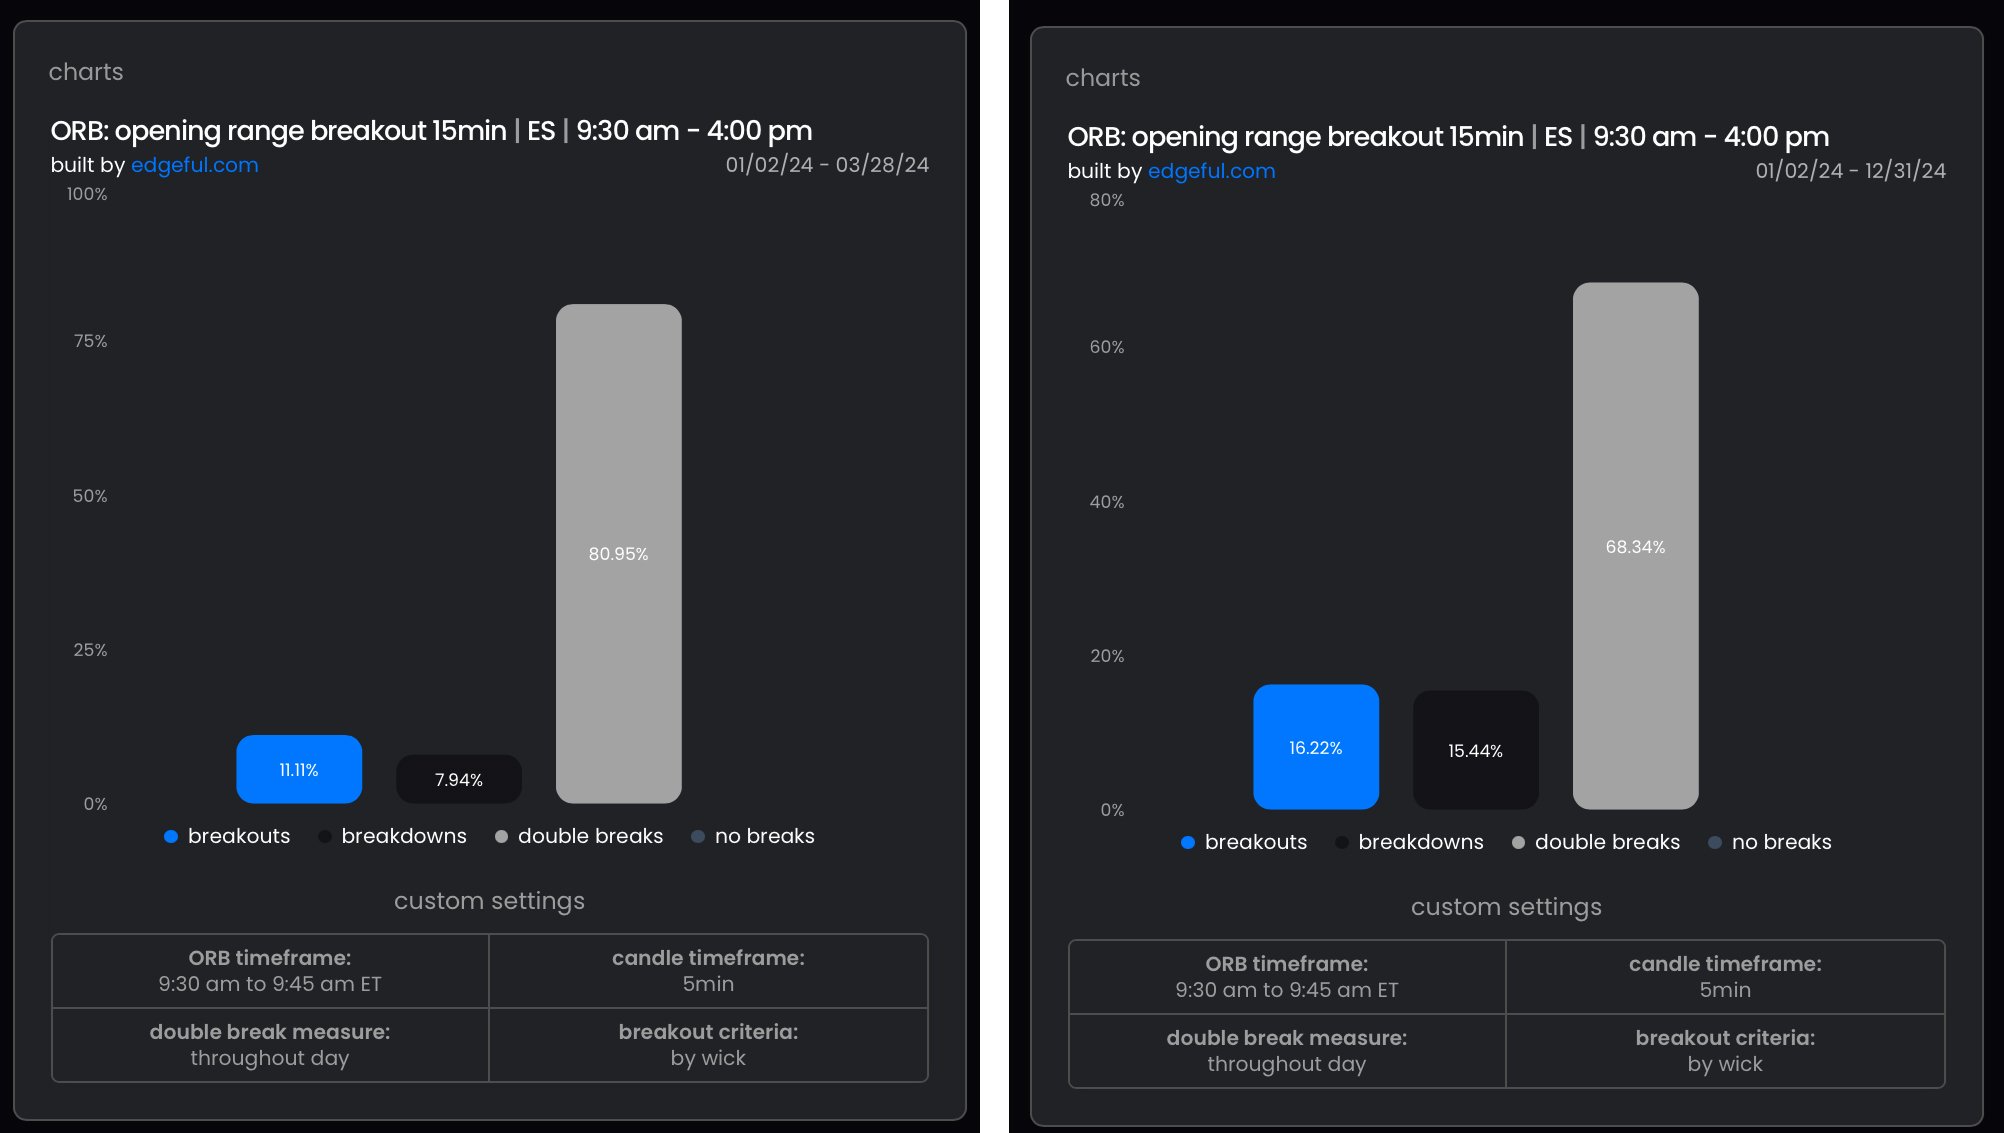 Figures 4 and 5: 15-minute opening range breakout (ORB) on ES, New York session, three months (left) compared to one year of performance (right)• Takeaways from Q1 of 2024: Double breaks happened over 80% of the time.
• Takeaways from Q1 to Q4 of 2024: Double breaks happened 68% of the time.
Why is this important? If your trading strategy is built on the expectation that price will break both sides of the 15-minute opening range breakout (ORB), that would have worked for you in Q1 of 2024 but not in Q4. This example shows how the most recent data can help you build trading strategies based on the current market environment, setting entries and exits in high-probability zones.
So far, we’ve covered how historical data can help you spot trends, technical trading patterns, and high-probability trades. We’ve also shown you why it’s important to look at the most recent data to get a feel for the current market environment. Let’s dive one layer deeper to see how the data changes on different weekdays.
Market Behavior’s Influence On Different Days Of The Week
One often overlooked factor in trading is the day of the week effect. The idea here is that market behavior can significantly vary Monday through Friday. Institutional traders, retail traders, and market makers all have different behavioral patterns throughout the week, leading to distinct market conditions and price action on different days.
Here is an analysis on NQ’s price action for the period 08/09/20 – 02/06/21 (one year). This report measures how often gaps tend to fill—when there’s a gap down or a gap up on a given weekday.
What we find is that on Tuesdays, gaps up and down fill about 70% of the time, which is amazing. Now looking at Mondays, we see that only 53% of gaps up have filled, and the majority of gaps down have not filled, at 64%.
A single day can make a big difference. Always keep in mind what weekday you’re trading, because they each have their own personality.
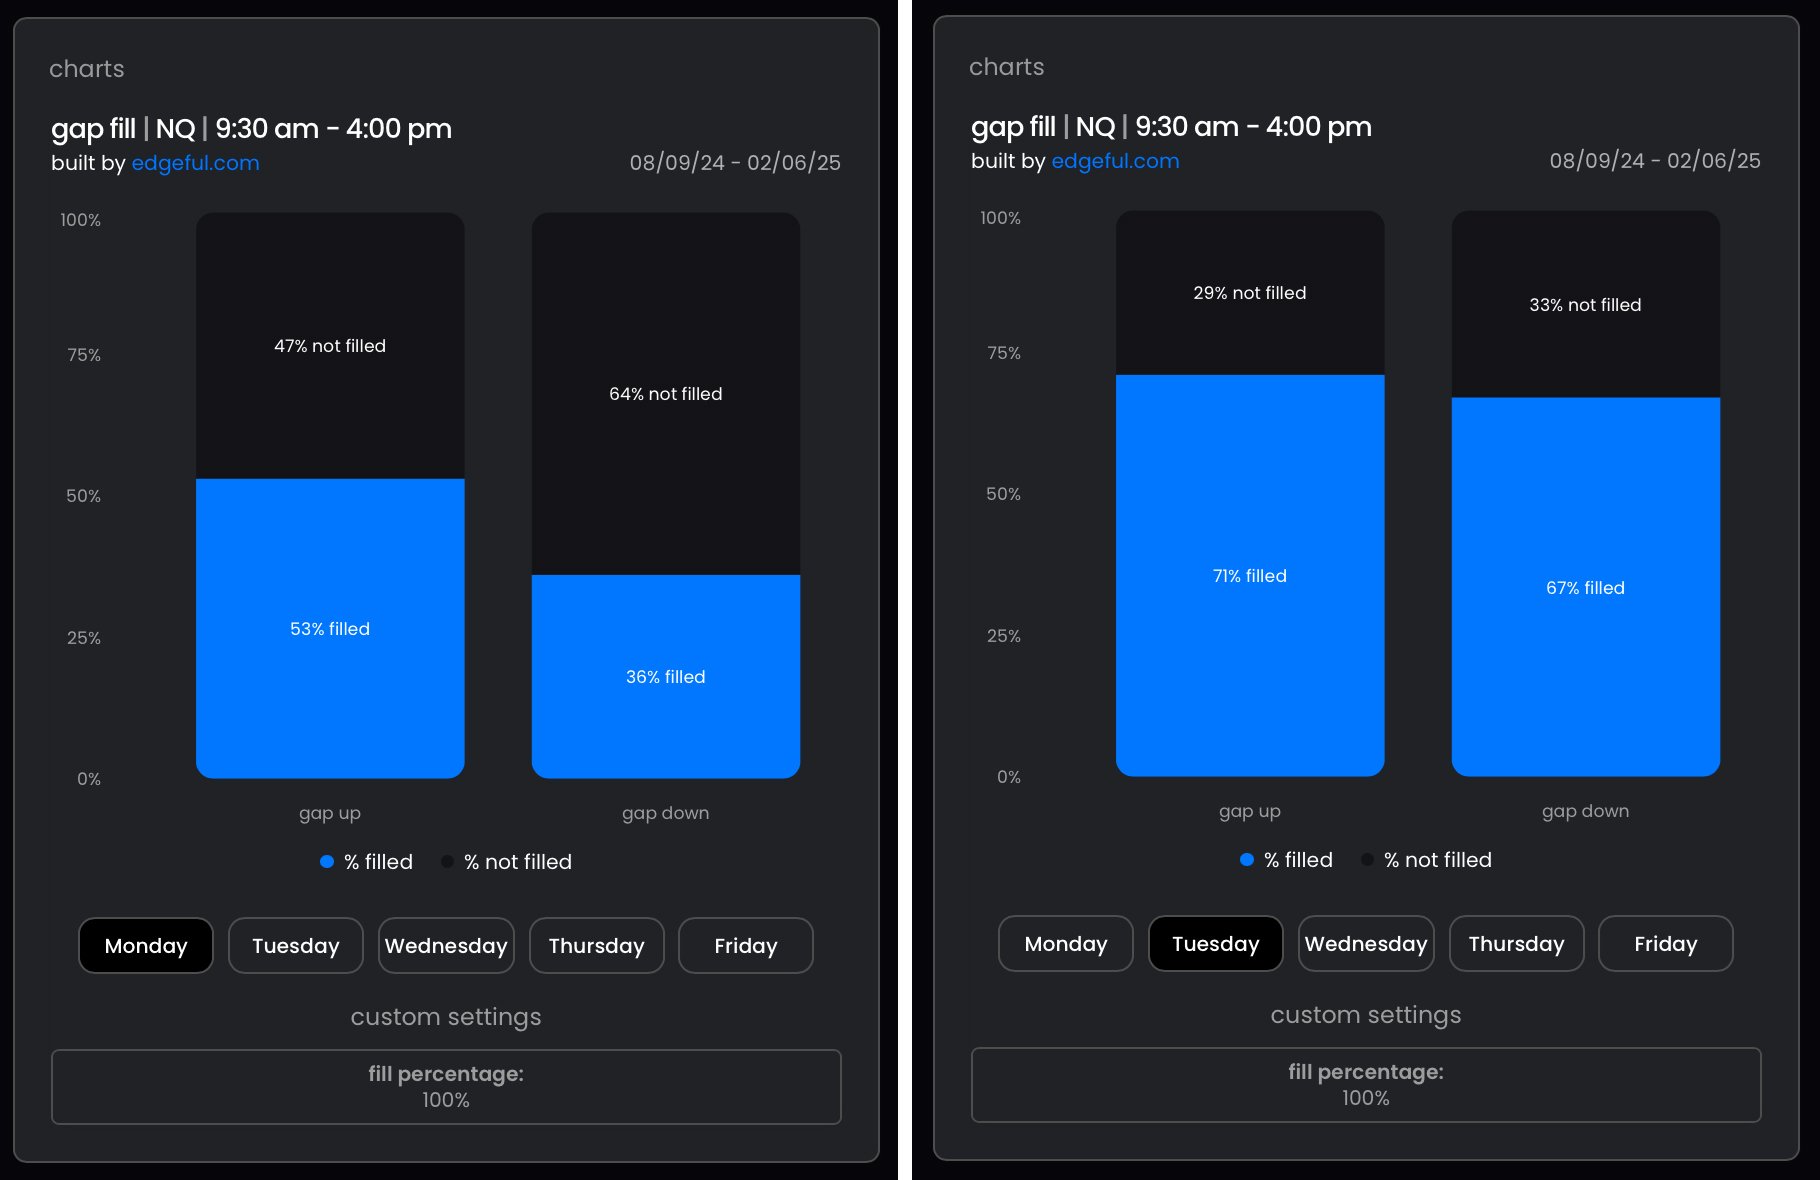 Figures 6 and 7: Gap fill report, by weekday, with a focus on Mondays and Tuesdays only for NQ, New York sessionUnderstanding these types of behavioral shifts during the week highlights the need for traders to adapt to the market in front of them and not assume every day will behave the same.
Turning Historical Trends And Data Into A Trading Edge
While identifying high-probability setups can be crucial, trading success ultimately depends on account, position, and risk management. A pattern with a 65% win rate may sound promising, but without proper risk controls, the right risk/reward ratio, and discipline, traders can incur significant losses.
The markets may seem unpredictable, but technical trading patterns and behaviors emerge when analyzed with data. By studying historical trends, recognizing the influence of different days on price action, and applying statistical insights to risk management, traders can build a strategy that’s built on both facts and historical patterns. The goal is not to predict every market move but to stack the odds in your favor and execute with confidence. When data drives decision-making, trading can shift from speculation to a calculated pursuit—one where preparation and discipline can lead to long-term success.
Taking The Next Step
You can see the data and insights created by Edgeful as part of the weekday NinjaTrader Livestream on YouTube, or you can visit Edgeful.com for more information.

Trade Futures with NinjaTrader
Haven't signed up for your free NinjaTrader account yet? Get started today with a 14-day trial of live simulated futures trading.
All content and related materials here are provided by NinjaTrader LLC and are for educational purposes only. All ideas, symbols, procedures, indicators, and strategies discussed are for demonstrational purposes only and are not trade recommendations. Active futures trading is not suitable for everyone. It is highly advised that you practice in a trading simulation environment before risking real dollars. You can find additional disclosure information here.
