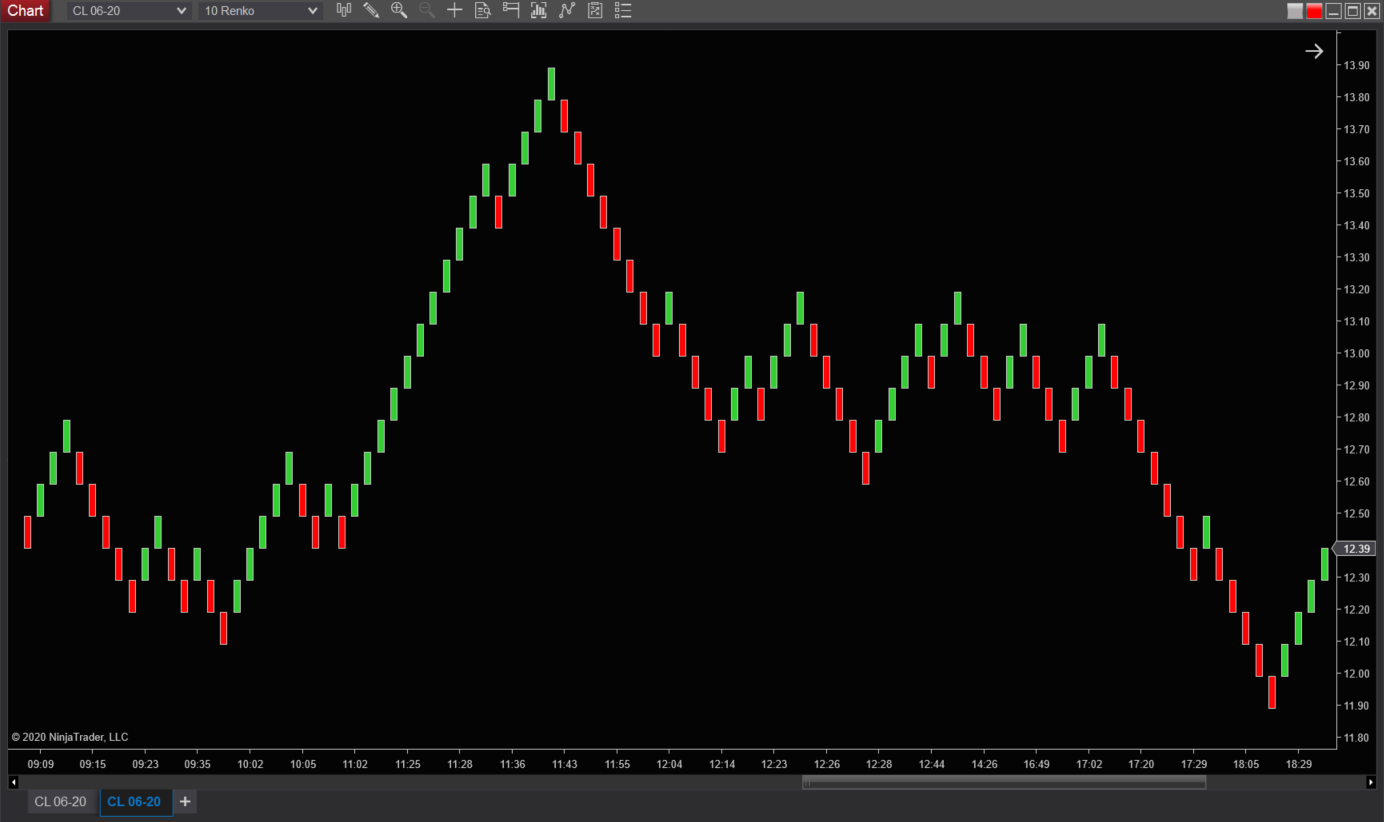
Renko charts are used in technical analysis to simplify price action and help identify trending and non-trending markets. When compared to traditional candlestick charts, Renko charts are unique in that they are built solely on price movement without taking time into account.
What are Renko Bars & Renko Charts?
Created in Japan, Renko bars are thought to have gotten their name from the Japanese word for bricks, renga. Each new Renko bar, or “Renko brick,” is formed only after the price has moved a specified amount, known as the brick size. This differs from traditional candles which are formed after a specified period of time has elapsed.
Additionally, Renko bricks are always positioned at a 45-degree angle either up or down from the previous brick and never side-by side, as seen in the chart below.
How to Create a Renko Chart in 4 Easy Steps
- From the Control Center, click New > Chart
- Select an instrument in the top left-hand corner
- In the right-side panel, set the Type to Renko
- Configure any other parameters including Brick size, and click OK

Renko Based Solely on Price
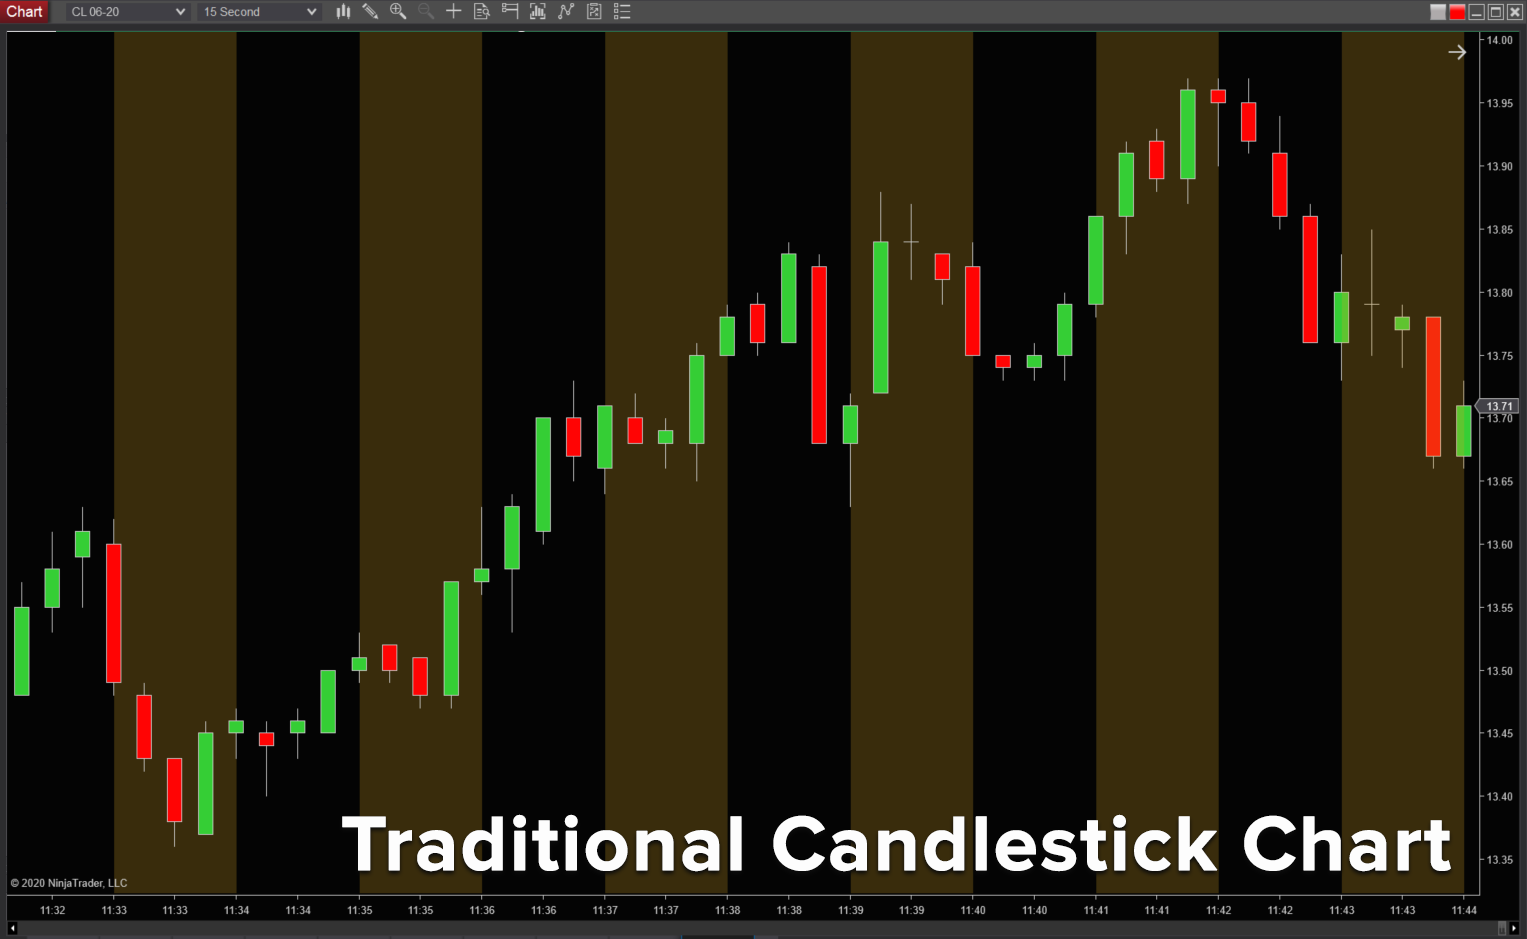
In the chart below, a traditional 15-second candlestick chart is shown with alternating gold and black sections to denote when each minute of time passed. Since traditional candles charts are a time-based interval, each minute is represented with the same distance on the x-axis (even intervals).

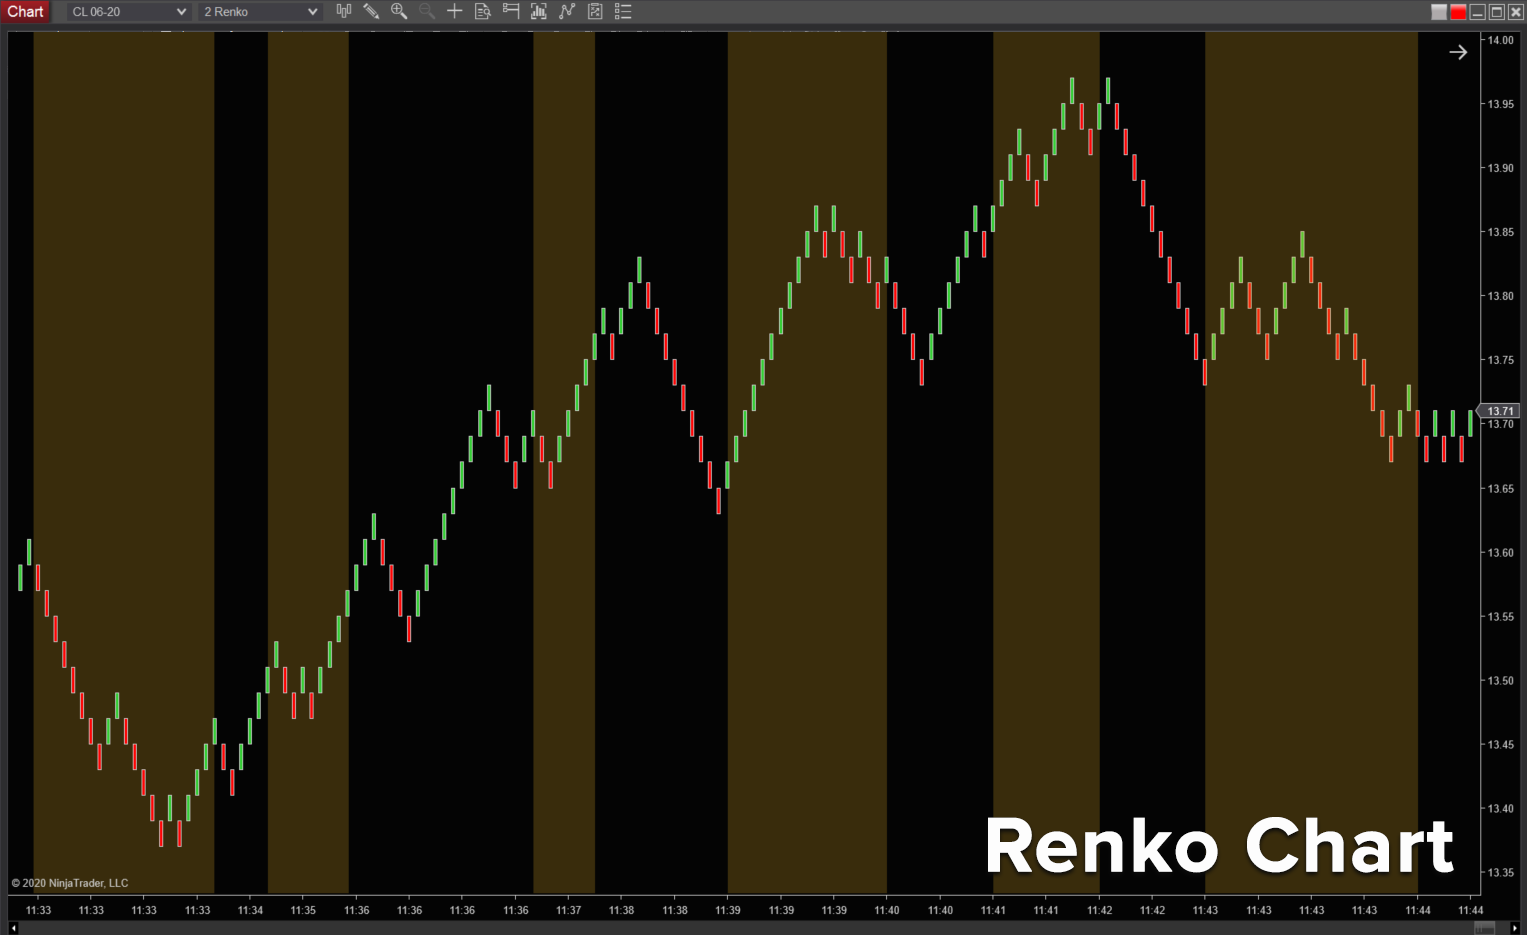
In the next example, a 2-tick Renko chart is shown over the same period of time. Since Renko bars are formed based on price information alone with no regard to time, each minute of time contains a varying amount of bricks. Although Renko charts are not time-based, the passage of time is still represented on the x-axis.

Track Trending vs Choppy Markets with Renko Charts
Renko bars can be especially useful in trading strategies for identifying when a market is in a trend vs. trading sideways.
Areas can identify a potentially trending market with several consecutive green or red bricks. Choppy, whipsaw trading can be detected by alternating red and green bricks.
In addition to multiple chart styles, bar types and drawing tools, NinjaTrader is equipped with over 100 built-in trading indicators to assist in your technical analysis of the markets. Join the world of market charting & trading analysis and download the award-winning NinjaTrader trading platform today!

