The parabolic SAR (stop and reverse) is a trend-following indicator based on time and price. It was introduced in 1978 by one of the pioneers of technical analysis, Wells Wilder. Named after the parabolas that are formed by a series of plotted dots, the indicator is designed to stop and reverse with changing market trends.
Learn more about the parabolic SAR in this short video:
How does the Parabolic SAR work?
The parabolic SAR is used to indicate potential reversals in the price of an asset. It displays as a series of dots that will appear either above or below the current price, depending on the direction of the price trend.
- If the dots are below the price, it means the market is in an uptrend. If the dots are above the price, the market is in a downtrend. (Figure 1)
- When the dots switch from being below the price to above the price (ending a downtrend) or from being above the price to below the price (ending an uptrend), a reversal is signaled.
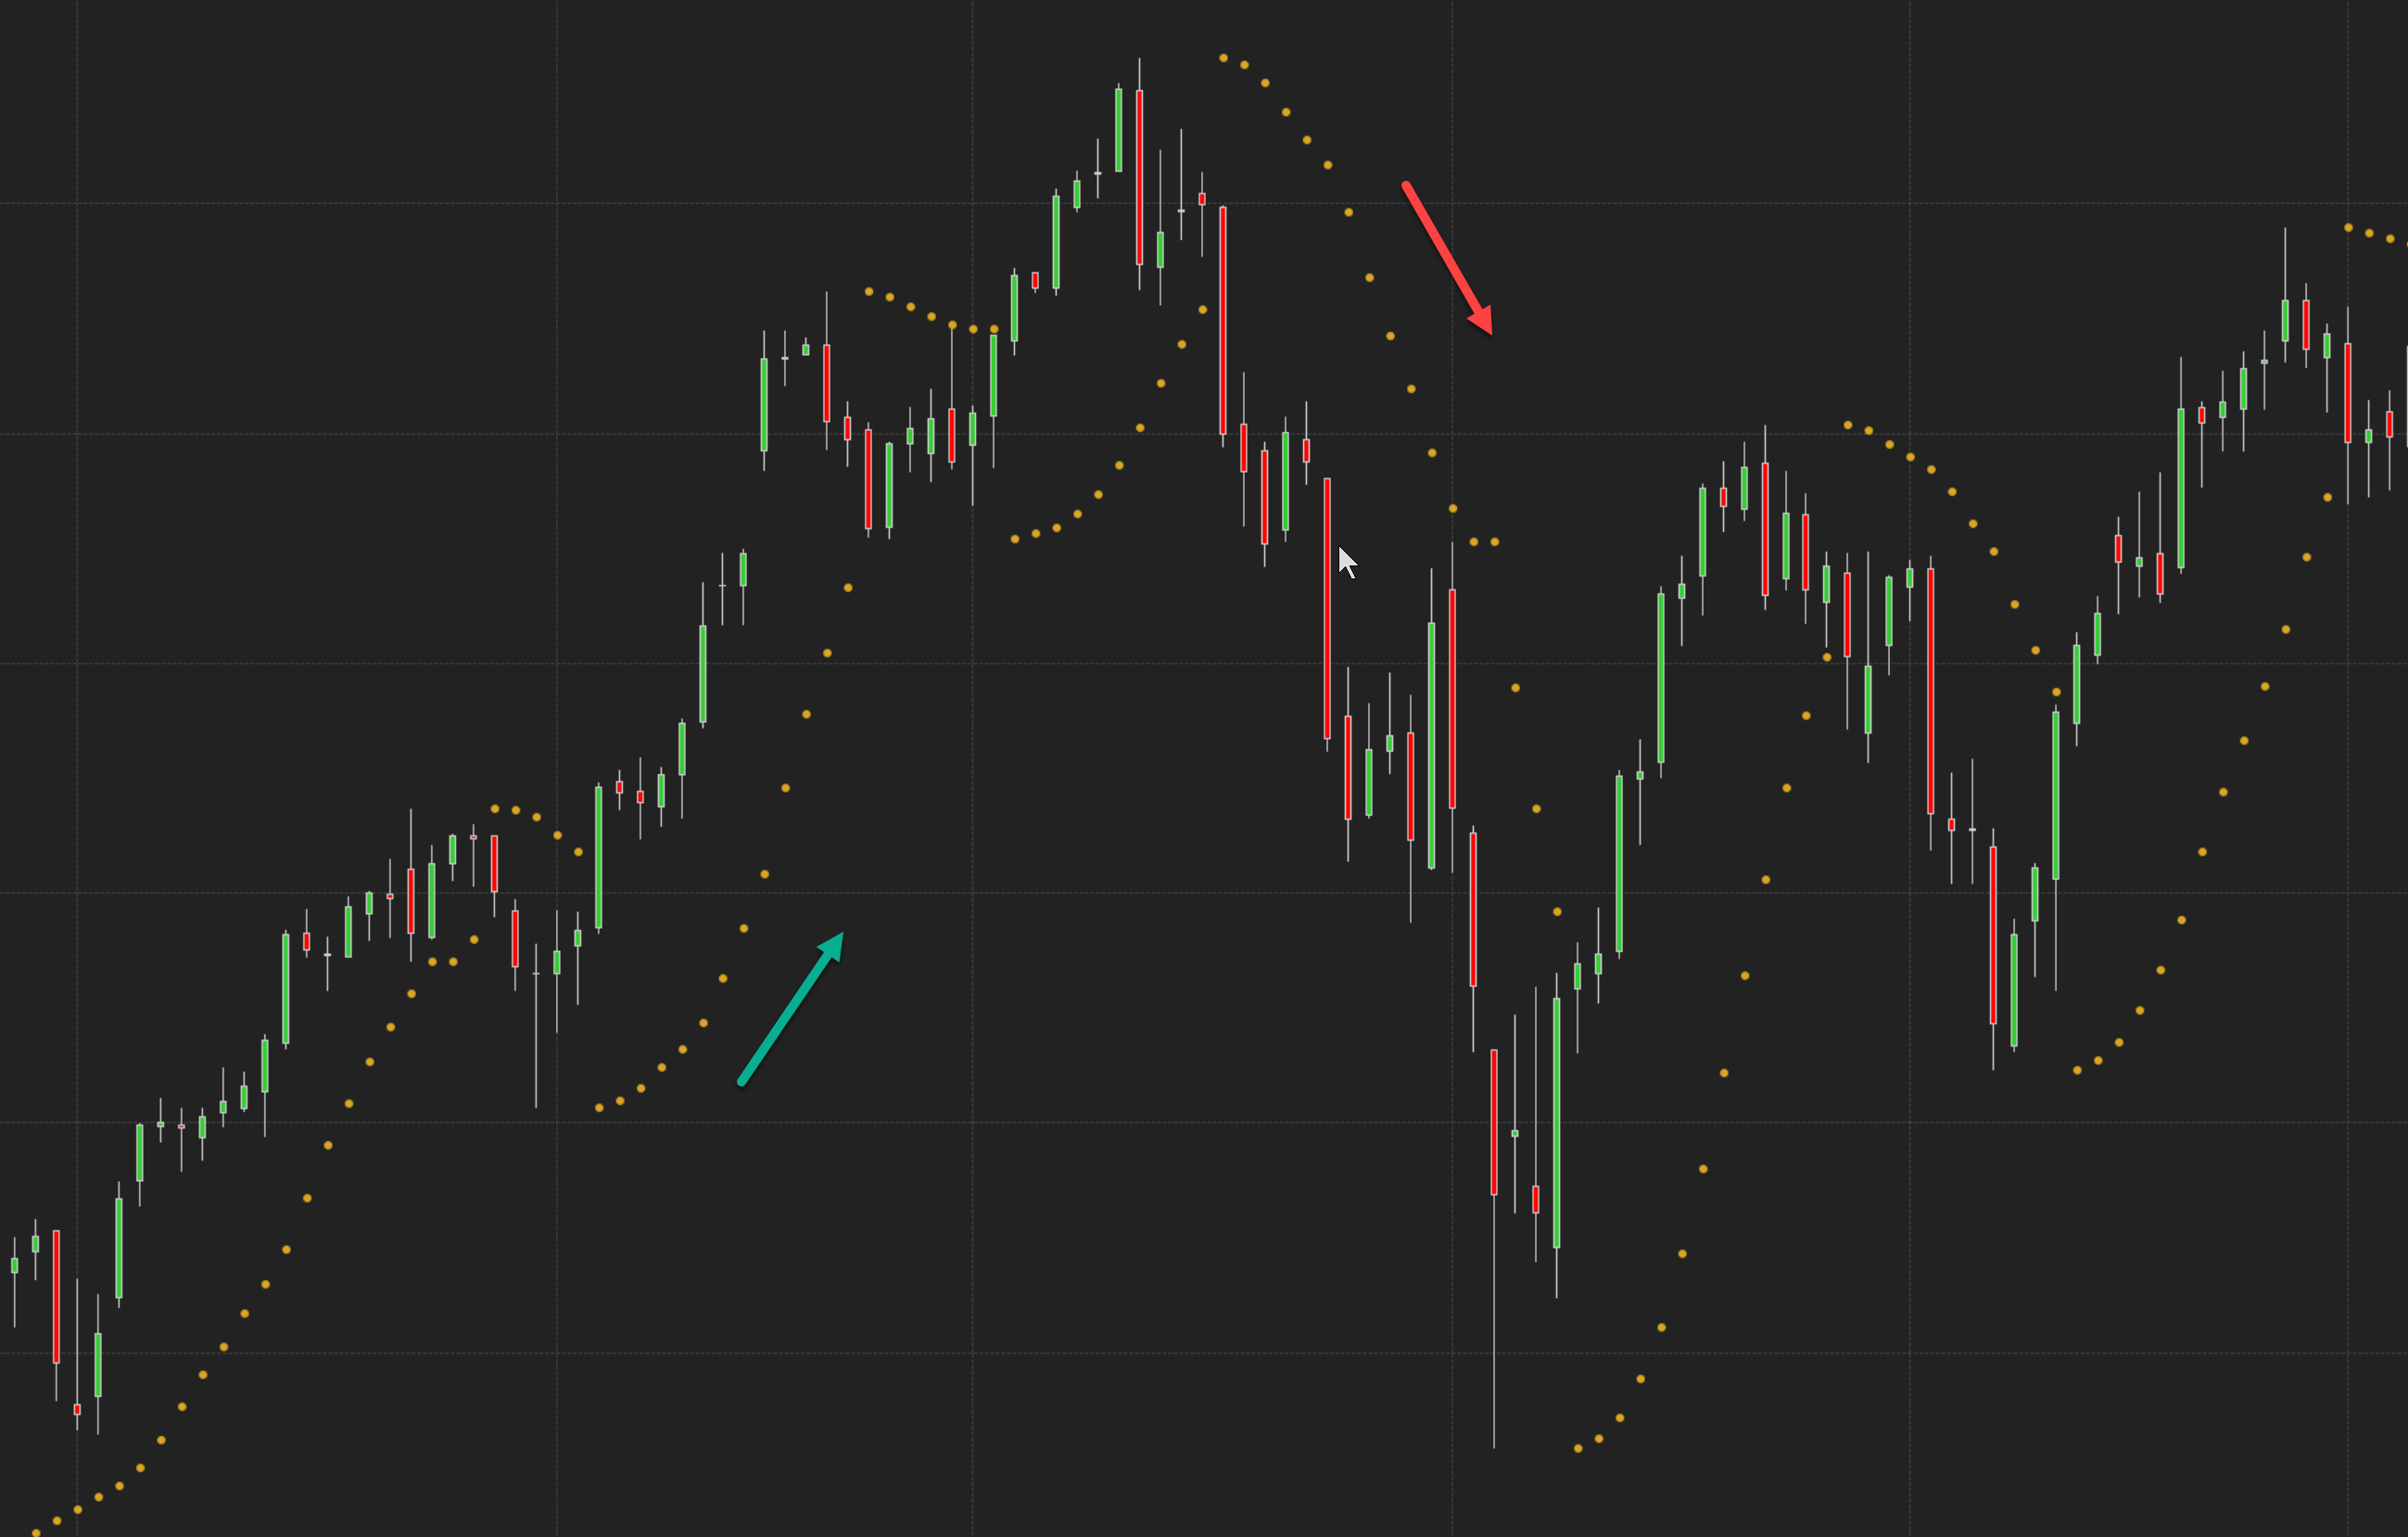 Figure 1: Parabolic SAR on a daily chart of NASDAQ futures As the price approaches a potential reversal point, the dots will begin to converge. When the price reverses, the dots will shift and start to diverge again. The parabolic SAR can be used to help confirm reversal signals from other indicators, or it can be used on its own.
Using the Parabolic SAR for Smarter Trading Decisions
The parabolic SAR is a useful tool for traders who want to stay in trends for longer periods of time. The indicator can also be used to help exit trends early, before a reversal. Some traders also use the distance between the parabolic SAR point and the price to calculate a trailing stop-loss order.
The NinjaTrader platform allows you to attach orders to indicators, (Figure 2) which effectively automates the stop-loss or profit target order price based on the parabolic SAR position on a chart.
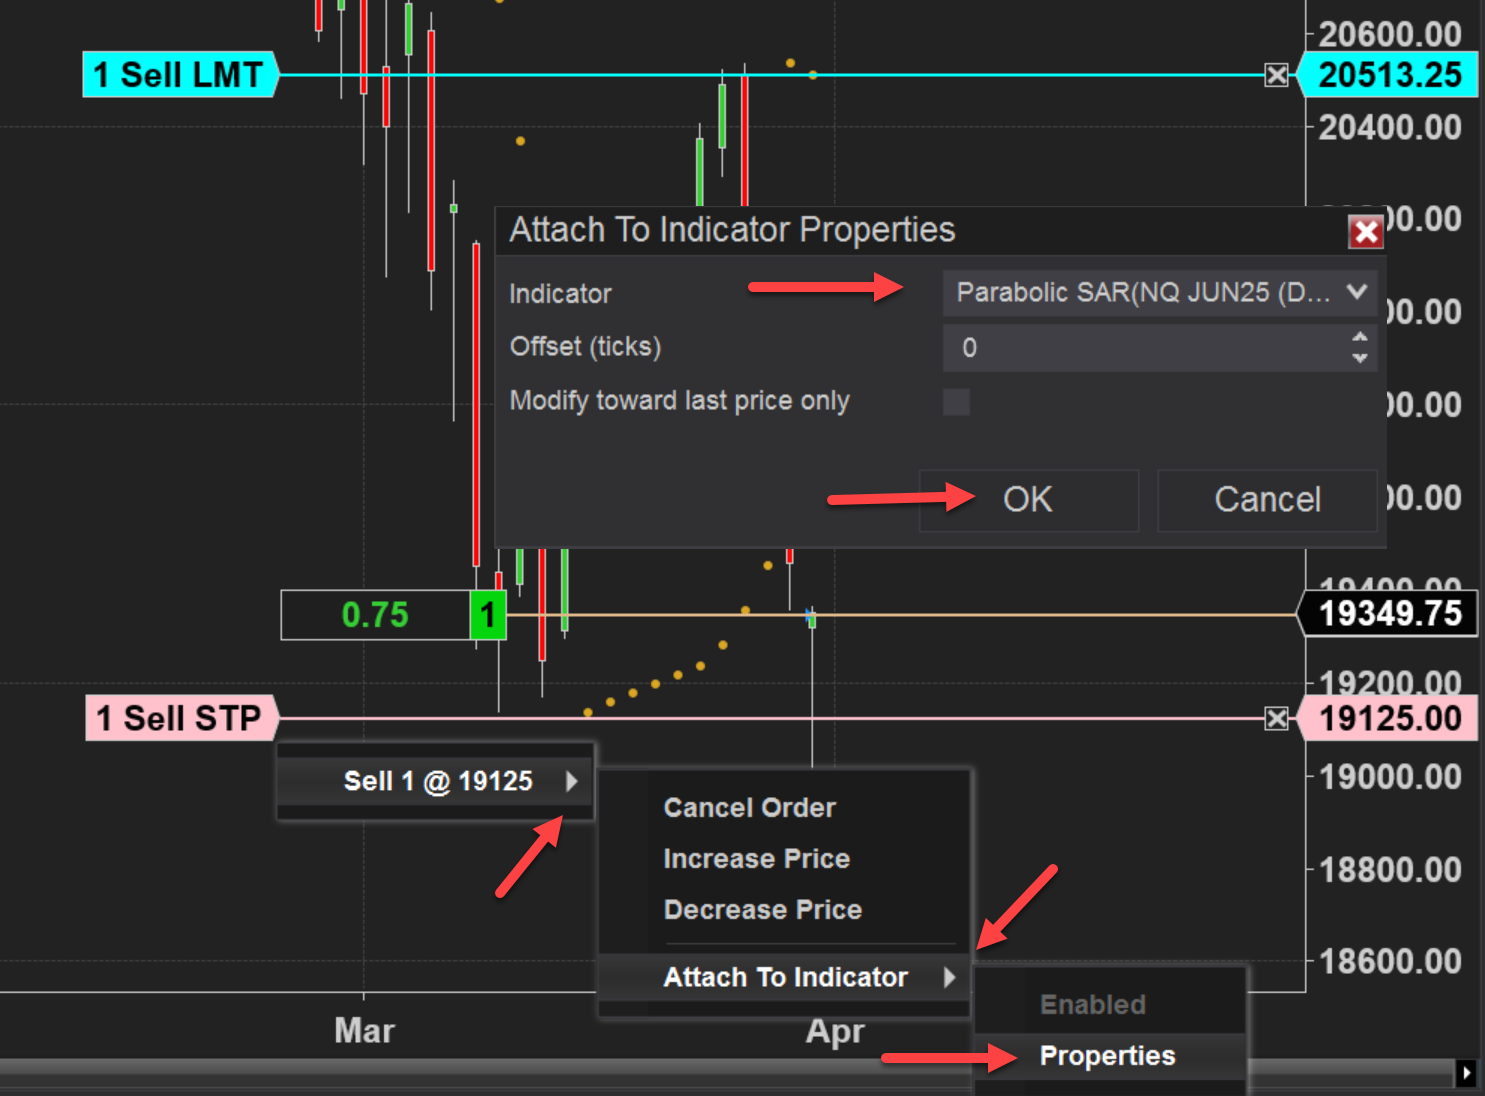 Figure 2: Attach an order to an indicator by right clicking on an order on the chart.
Learn how to attach an order to an indicator.
Parabolic SAR Parameters
There is not a universal setting for the parabolic SAR, so it’s recommended to adjust and experiment with the following inputs based on the targeted instrument characteristics:
- Acceleration: A multiplier that impacts the range of change for the SAR; set to .02 by default
- Acceleration max: A user-defined input that dictates the max value of the acceleration
- Acceleration step: Defines the increase each time the most recent extreme (high or low) is achieved; set to .02 by default
While the calculation of the parabolic SAR is fairly complex, the results are incredibly instinctive. This makes it a popular complimentary indicator for use in a variety of trading systems.
Benefits and Drawbacks of the Parabolic SAR
There are several benefits of using the parabolic SAR indicator:
- It can help you identify potential turning points in the market.
- It can help you stay in a trade longer if the market is still moving in your favor.
- It can help you exit a trade sooner if the market begins to turn against you.
While the parabolic SAR can be helpful for spotting market reversals, it’s not without its limitations. Here are a few of its weaknesses to be aware of:
- It is considered a lagging indicator and can be slow to react to price changes.
- It can give false signals in choppy markets.
- It can produce false signals in range bound markets.
Because of these weaknesses, many traders pair the parabolic SAR with other indicators, such as moving averages, MACD, or RSI. By combining the parabolic SAR with complementary indicators, traders can filter out false signals and improve their overall strategy. As with any technical tool, it's essential to test its effectiveness within your trading plan before relying on it in live markets.
Using the Parabolic SAR in the NinjaTrader Platform
The Parabolic SAR can be a powerful tool for identifying trend reversals and optimizing trade entries and exits. While it has its limitations, integrating it with other indicators and customizing its settings can enhance its effectiveness. Whether you're looking to refine your trading strategy or automate stop-loss placement, the NinjaTrader platform provides the tools you need to make the most of this versatile indicator.
Unlock Free Exclusive Training
Explore the foundational concepts of technical analysis with our free multi-video trading course Technical Analysis Made Easy. Learn how to analyze and anticipate market movements using market prices, volume data, and more.

Trade Futures with NinjaTrader
Haven't signed up for your free NinjaTrader account yet? Get started today with a 14-day trial of live simulated futures trading.
