
Order Flow Trading With NinjaTrader: Footprint Charts and Market Depth
Read futures order flow as it happens — footprint charts, cumulative delta, volume profile, and market depth, built natively into the NinjaTrader platform.
Get Started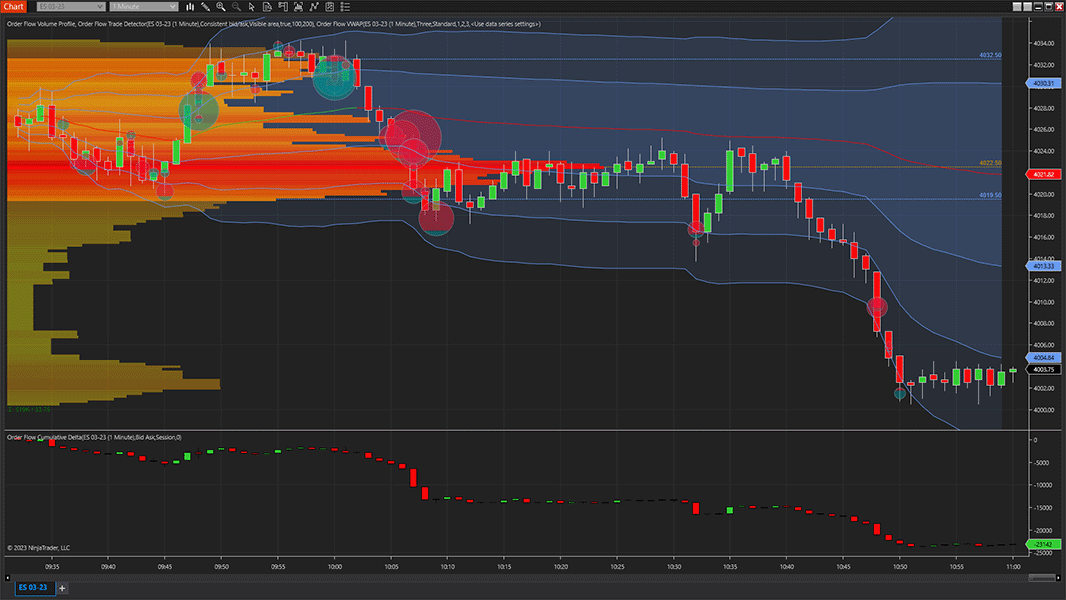
What is order flow trading?
Order flow trading is a method of analyzing futures markets by tracking the actual buy and sell volume executed at each price level, rather than just the price itself. It uses tools like footprint charts, cumulative delta, and market depth to reveal which side—buyers or sellers—was more aggressive at any given moment, helping traders confirm setups and gauge momentum in real time. For futures markets specifically, order flow analysis is especially effective because trade data is centralized at the exchange (CME), making bid-ask volume breakdowns standardized and reliable.
NinjaTrader's Order Flow+ feature set gives futures traders a complete toolkit for reading market participation as it happens: footprint charts (volumetric bars) showing bid and ask volume at every price, cumulative delta tracking the net flow of aggressive buyers vs. sellers, a market depth map that visualizes the live limit order book, and a volume profile tool for identifying high-volume support and resistance levels. These tools are built directly into the NinjaTrader platform and work natively with real-time CME futures data, so order flow analysis operates on the same standardized exchange feeds the largest institutional desks use.
NinjaTrader Clearing, LLC (“NTC”) is registered with the Commodity Futures Trading Commission (CFTC) as a futures commission merchant (FCM) and is a National Futures Association (NFA) Member (NFA ID: 0309379). The Order Flow+ feature set is built and maintained by NinjaTrader, LLC, the platform software entity within the NinjaTrader Group of affiliated companies, and is used by both retail futures traders and CFTC-regulated brokerage clients.
How to read order flow with footprint charts and cumulative delta
Reading order flow comes down to a handful of order flow indicators for futures traders: footprint charts, cumulative delta, and volume profile, read together to confirm what price alone can't show. On a footprint chart, look for imbalance, absorption, and exhaustion, then use cumulative delta to confirm whether aggressive buying or selling supports the move.
Order flow tools in NinjaTrader Order Flow+
NinjaTrader's Order Flow+ suite includes the tools below; see the full Order Flow+ help documentation for setup details.
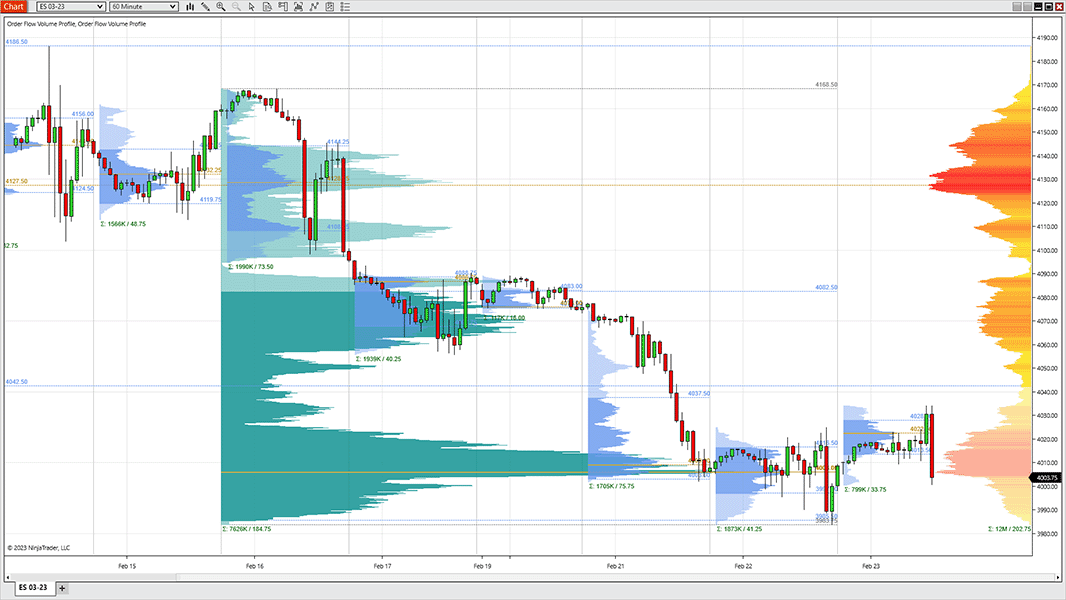
Volume profile: support, resistance, and value areas
Analyze the distribution of trading volume over price for a specified time range to identify significant levels of support and resistance with this comprehensive visual display.
- Multiple visualization modes
- Plot volume, delta, ticks, or price
- Display point of control and value areas
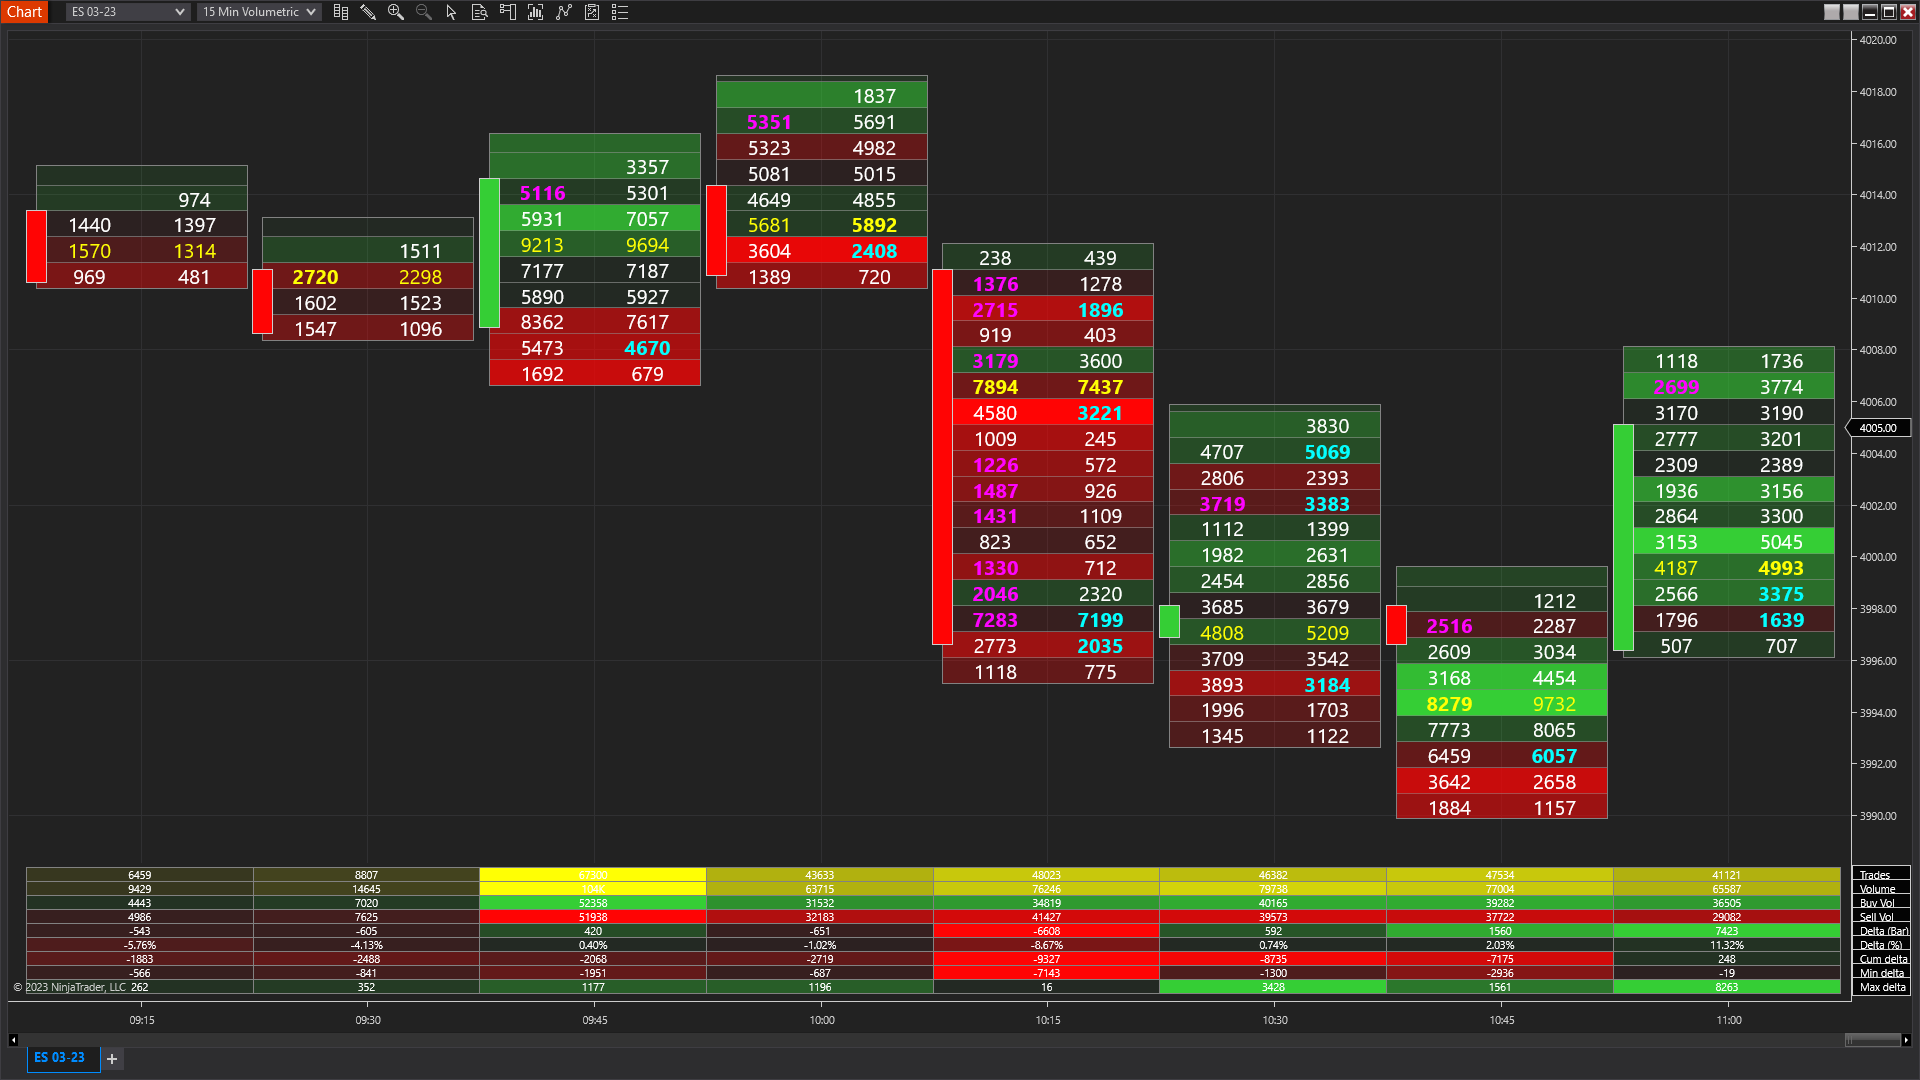
Volumetric bars (footprint charts): bid-ask volume at each price
Volumetric bars track buyers and sellers tick by tick, giving you a comprehensive view of the activity for order flow trading.
- Footprint-style visualization
- Show order flow imbalance
- Market delta analysis
- Identify volume clusters, absorption, exhaustion, and unfinished auction patterns
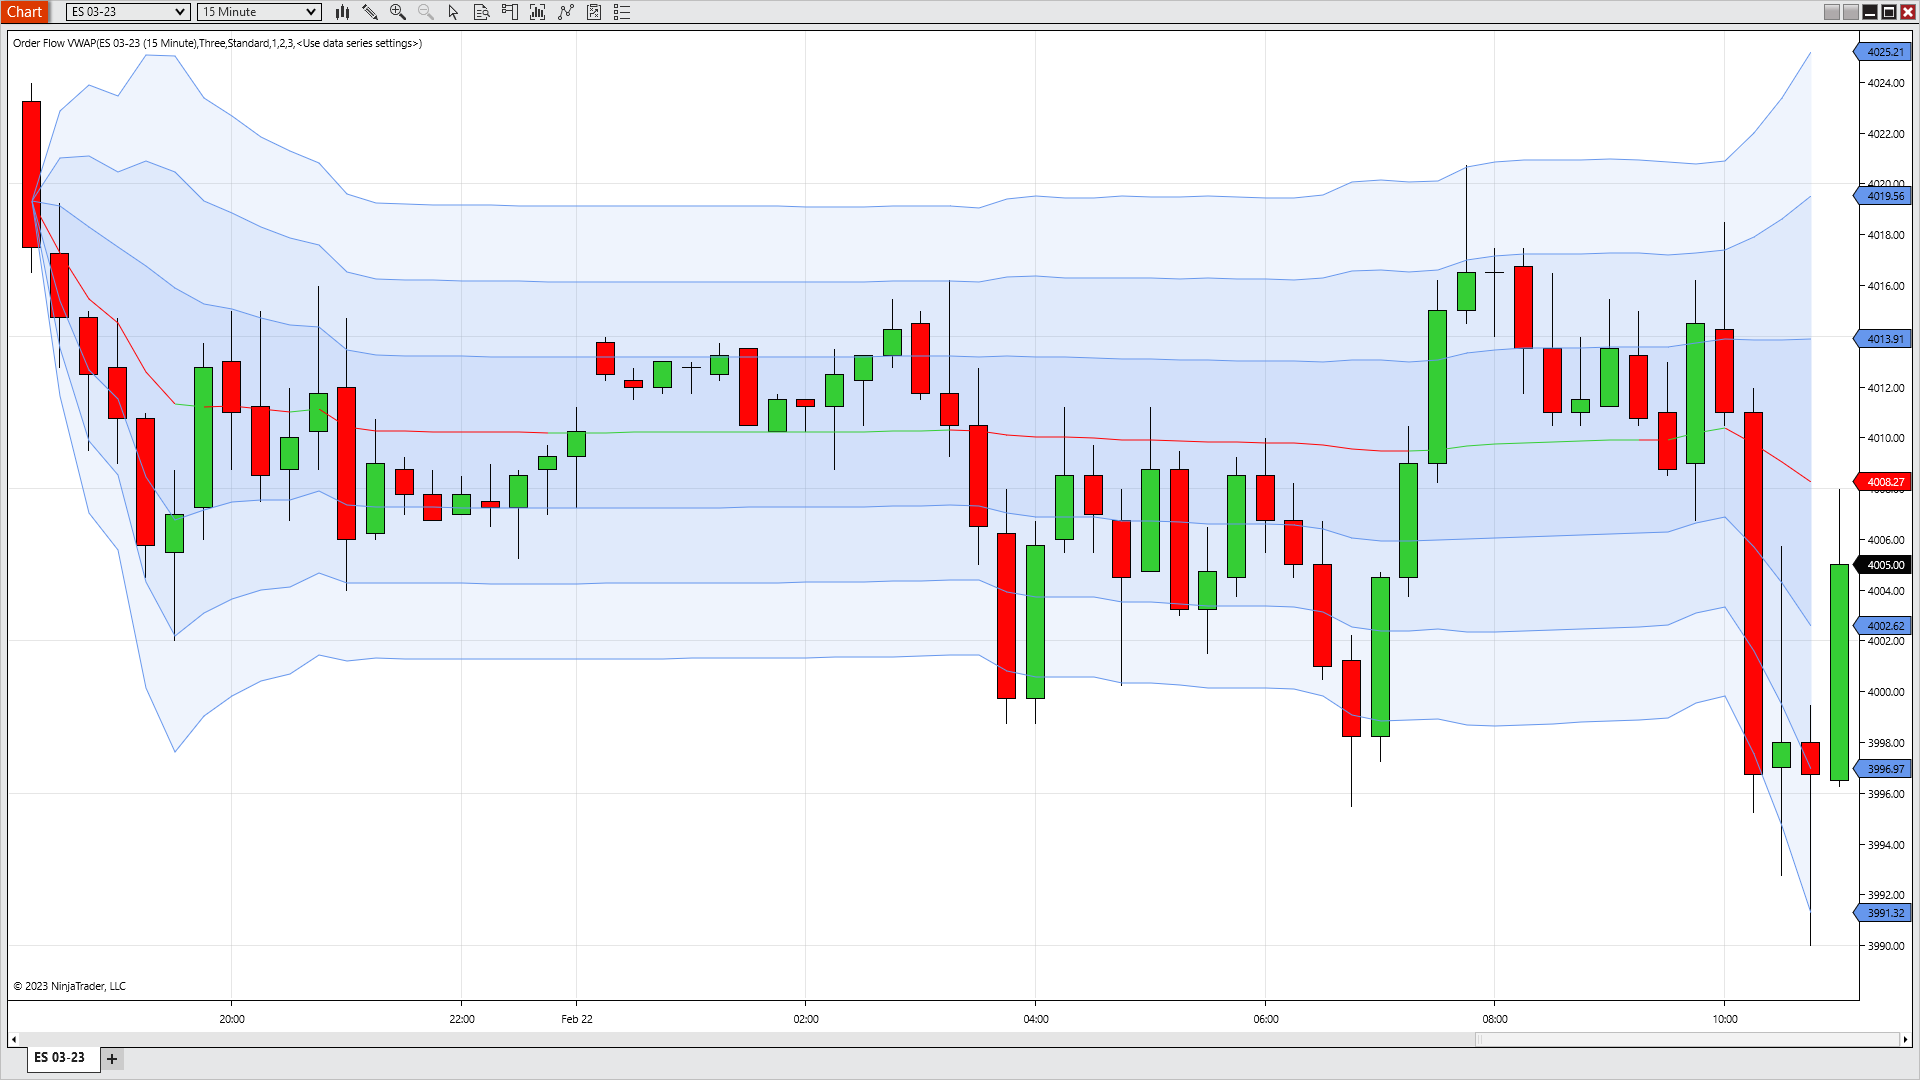
Order flow VWAP: volume-weighted price with deviation bands
Identify key price thresholds and measure momentum with volume-weighted average price (VWAP), a moving average that also incorporates volume data.
- Deviation bands indicate price levels where buying and selling pressure are anticipated
- Confirm trends and track price breakouts
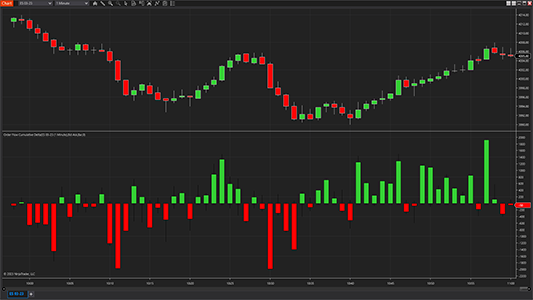
Cumulative delta: net buying vs. selling pressure over time
Track buying and selling with cumulative delta, a visual display of the net difference between buyers and sellers at each price level traded.
- Confirm or deny trends and gauge market strength
- Monitor buying vs. selling pressure to spot market reversals
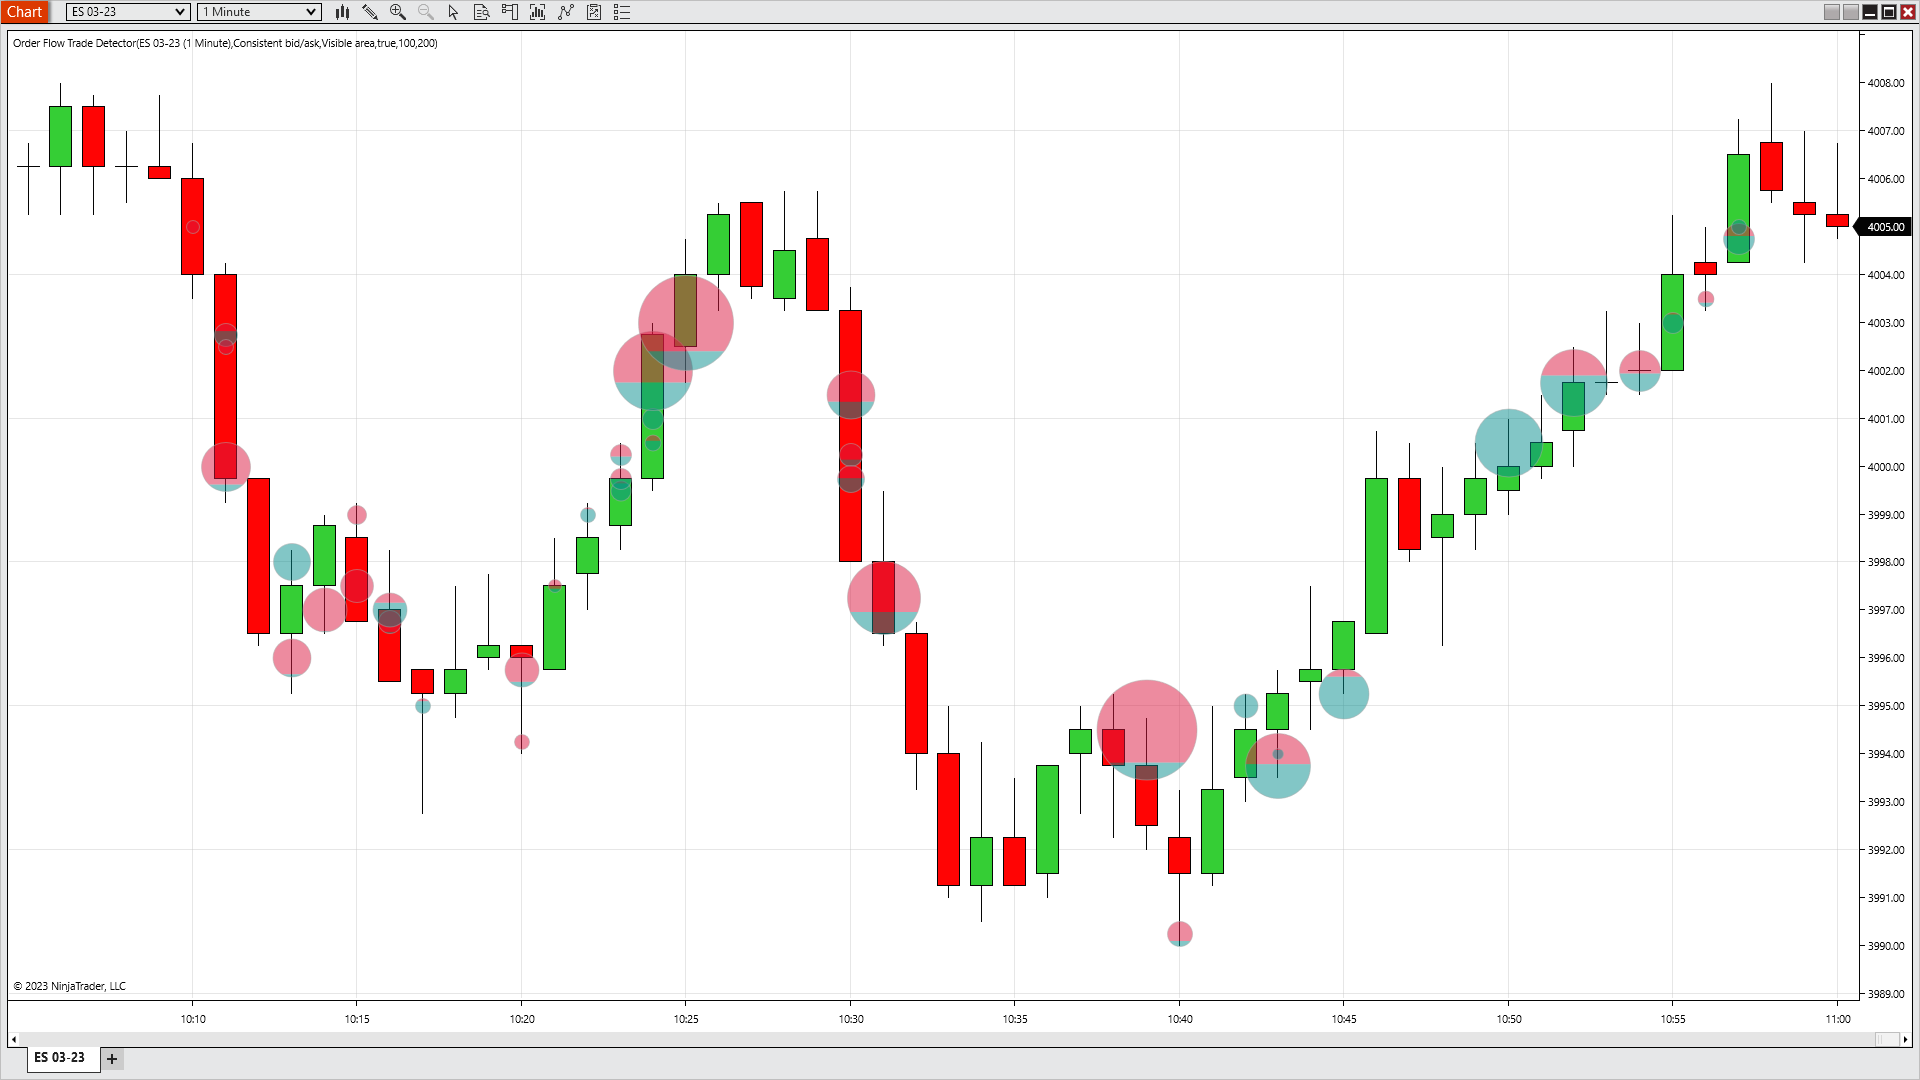
Trade detector: significant trade events on your chart
Analyze the tape and visualize significant trade events on your chart, a powerful combination when used with the Order Flow Market Depth Map.
- Tracks trades based on buyer or seller activity
- Display based on trade size or accumulation
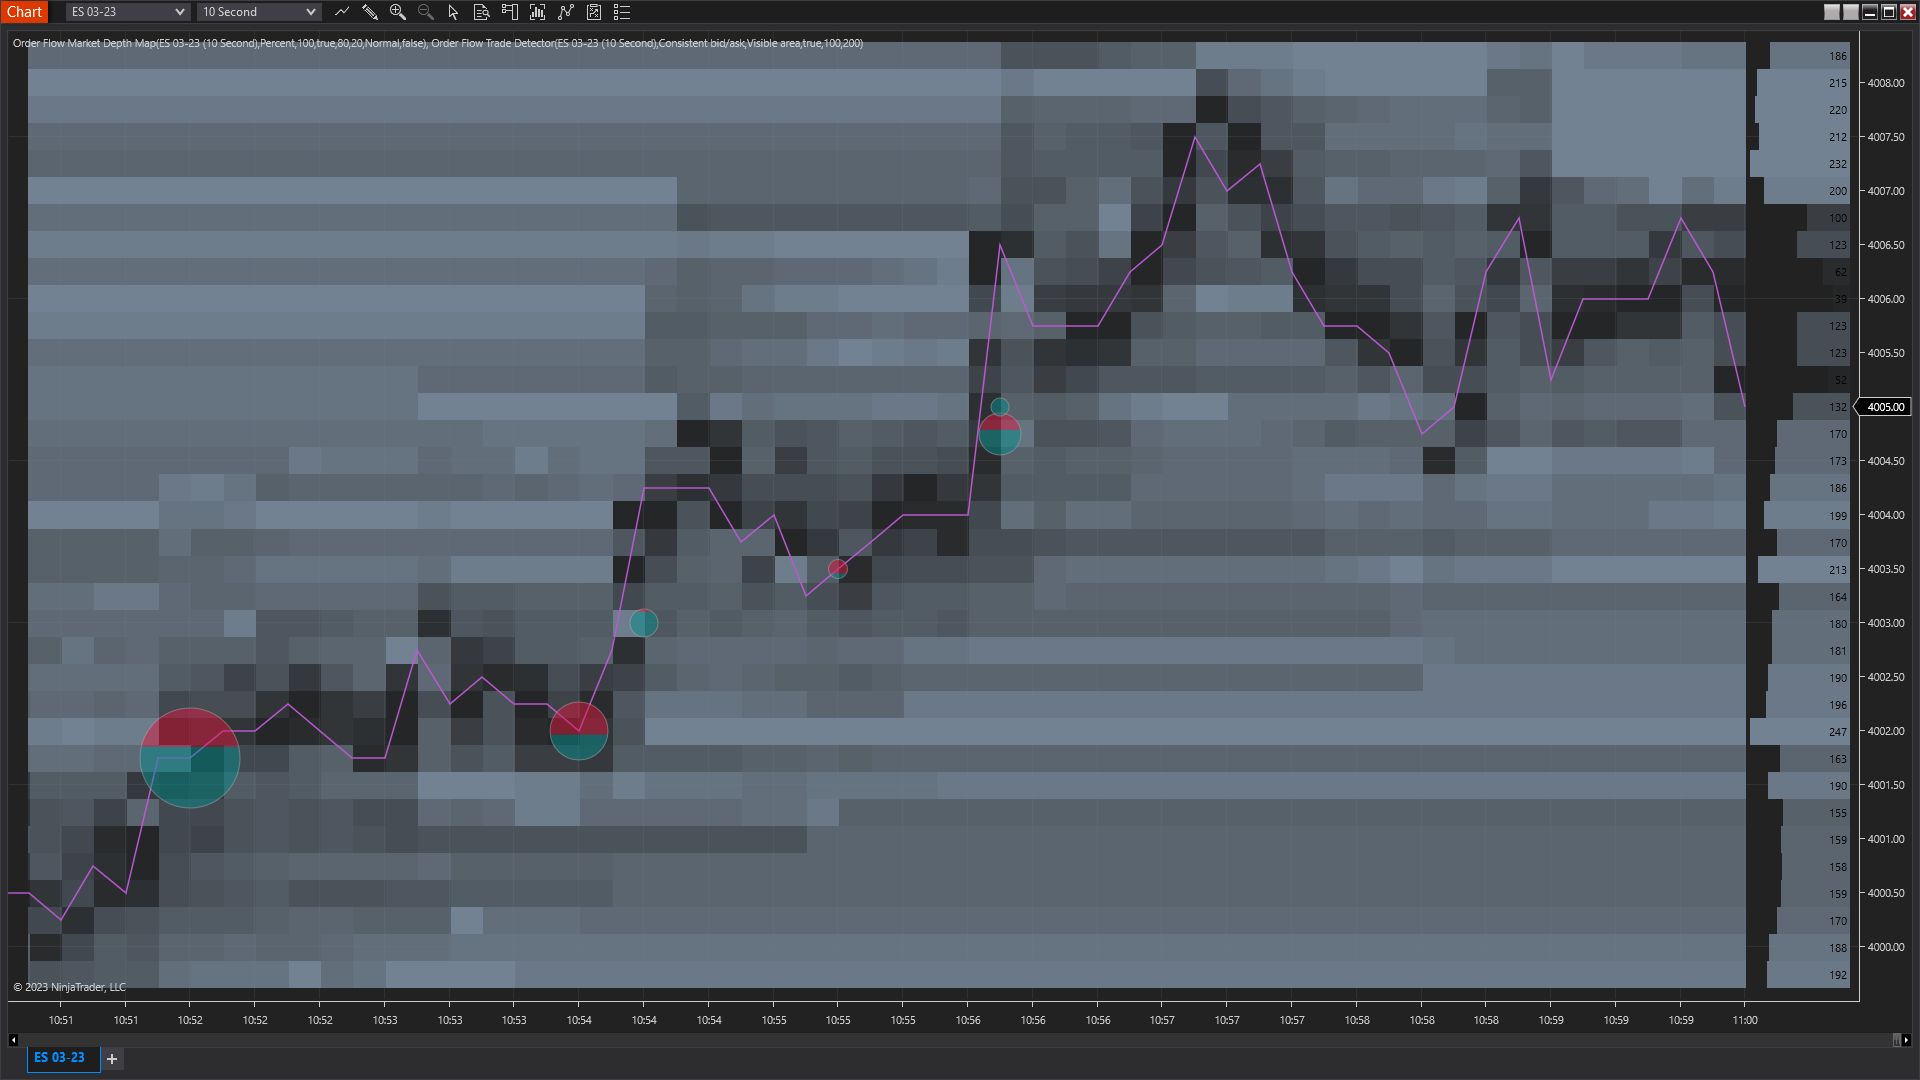
Market depth map: real-time visualization of the limit order book
Historic and real-time visualization of the limit order book, giving you clear insight into market depth and order flow.
- See the progression of the limit order book
- Easily identify supply and demand
Why futures markets are ideal for order flow analysis
Unlike equities, where order flow is fragmented across dozens of venues and dark pools, futures markets are centralized: every E-mini S&P 500, crude oil, or 10-year Treasury futures contract trades on a single exchange (CME Group's CME, CBOT, NYMEX, or COMEX venues). That centralization makes bid-ask volume data standardized, reliable, and complete in a way that's impossible in stock markets.
For active futures traders, this means a footprint chart on the Micro E-mini Nasdaq tells a single, authoritative story about who's buying and selling—not a fragmented partial view. Cumulative delta on a CME futures contract reflects the full market, not a slice of it. That's why order flow analysis has historically been most heavily used by professional futures and options desks, and why retail futures traders now have access to the same exchange-level data through tools like NinjaTrader Order Flow+.
Frequently asked questions about order flow trading
What is order flow trading?
Order flow trading is a method of analyzing futures markets by tracking the actual buy and sell volume executed at each price level, rather than just the price itself. It uses tools like footprint charts, cumulative delta, and market depth to show which side—buyers or sellers—was more aggressive at any given moment. The goal is to confirm setups, time entries more precisely, and gauge momentum in real time using the same exchange-centralized data professional desks rely on.
How do you read order flow?
Start with a footprint chart (volumetric bars in NinjaTrader) and look for three patterns: imbalance, where one side dramatically outweighs the other at a price level; absorption, where heavy volume fails to move price; and exhaustion, where volume dries up at an extreme. Then overlay cumulative delta to confirm whether the net flow of aggressive trades supports or contradicts the price action. Most order flow traders treat the footprint as the primary signal and cumulative delta as the confirmation filter.
What is a footprint chart?
A footprint chart displays the buy and sell volume transacted at each individual price level within a bar, giving traders visibility into whether buyers or sellers were more aggressive—information that a standard candlestick chart does not show. In NinjaTrader, footprint charts are called volumetric bars, and they're part of the Order Flow+ feature set. Footprint charts are most useful in centralized futures markets like the CME, where bid-ask volume data is standardized at the exchange level.
Is order flow trading worth it?
For active intraday futures traders—scalpers, day traders, and short-term momentum traders—order flow tools can add a layer of insight that price action alone doesn't provide, particularly around confirming breakouts, identifying absorption at support and resistance, and spotting reversals before they show up in price. It is less useful for swing traders, position traders, or anyone trading on longer timeframes where individual trade-by-trade volume matters less. The tools have a learning curve and don't generate signals on their own, so the lowest-risk way to learn them is in the NinjaTrader trading simulator.
Get started with Order Flow+ in the NinjaTrader simulator
Get started on your trading journey with NinjaTrader's free simulated trading powered by live market data, or see Order Flow+ pricing to add the suite to your account.

— Regulatory Disclosures —
NinjaTrader is a group of affiliated companies operating under NinjaTrader Group, LLC ("NTG"), including NinjaTrader, LLC ("NT") and NinjaTrader Clearing, LLC d/b/a NinjaTrader, Kraken Derivatives US, and Tradovate ("NTC"). NT owns and supports the proprietary NinjaTrader trading platform as a software development company, while NTC provides brokerage services. View Disclosures.
NTC is registered with the Commodity Futures Trading Commission ("CFTC") as a futures commission merchant ("FCM") and is a National Futures Association ("NFA") Member (NFA ID: 0309379). Questions related to brokerage accounts should be directed to your broker.
Futures, security futures, options, foreign currency, digital asset, and event contract trading involves substantial risk and is not suitable for everyone. An investor may lose all or more than the initial investment. Trading should be undertaken only with risk capital—funds that can be lost without jeopardizing one’s financial security or lifestyle—and only by those who can afford such losses. Past performance is not necessarily indicative of future results. Prior to trading digital assets, review the CFTC and NFA advisories for additional information regarding the significant risks involved. View Risk Disclosure Statement, including the Risk Disclosure Statement for Security Futures Products.
Any trading symbols, company names, logos, or trademarks displayed are used for illustrative purposes only and remain the property of their respective owners. Their use does not imply affiliation with, endorsement by, or sponsorship of NinjaTrader, nor do any trading symbols displayed constitute investment advice or recommendations.
This website is provided by NinjaTrader on an "as-is" basis for informational purposes only and does not constitute investment advice, a recommendation, or an offer or solicitation to buy, sell, or hold any commodity interest or financial product or engage in any investment strategy. Content may include statements or opinions of NTG and its affiliates or third-party information; no representation or warranty, express or implied, is made as to the accuracy or completeness of the information herein. NinjaTrader disclaims all liability arising from use of or reliance on such information.
Simulated trading does not represent actual trading and is based on hypothetical conditions. Actual trading results may differ significantly due to factors such as market conditions, liquidity, execution, and the emotional and psychological impact of risking real money. Simulated trading is provided for educational and platform-familiarization purposes only and should not be relied upon as an indication or expectation of results in a live trading environment.