Cumulative delta, also called cumulative volume delta (CVD), is a running tally of the net difference between aggressive buying volume and aggressive selling volume in a futures market. Positive cumulative delta means buyers have been the more aggressive side over the period measured; negative means sellers have.
That running total is what separates it from the volume figure on a standard chart. Volume tells you how much traded. Cumulative delta tells you which side kept reaching across the spread to get filled, and whether that pressure built or faded as price moved. It sits near the center of order flow trading, and traders reach for it most often when price action and participation appear to disagree.
What is cumulative delta?
Delta is the net difference between buying and selling volume at each price level. Cumulative delta takes that figure and keeps adding it up, bar after bar, so what you read is a running total, with every earlier bar still in it.
Delta measures one bar, cumulative delta measures the session
A single bar's delta answers a narrow question. Over those 30 seconds, or those 30 minutes, did aggressive buyers or aggressive sellers do more volume? The answer resets with every new bar. Cumulative delta carries it forward instead, so a sequence of small positive readings shows up as a rising line, where separately they might look like unrelated numbers. Pressure that never looks dramatic on any one bar can still be obvious across two hours of them.
Cumulative delta, cumulative volume delta, and CVD
You'll see all three terms describing the same measurement. NinjaTrader labels the indicator cumulative delta. Much of the wider order flow field writes cumulative volume delta (CVD), and that's the term you'll see elsewhere most often. Nothing about the calculation changes with the label—so an article, an indicator, or a forum post using one term can be read against another using the other.
For a wider view of where this sits among the other readings, the order flow indicators hub covers the tape, Level 2 market data, and the depth of market alongside it.
How the number is produced matters before any of it can be read on a chart.
How cumulative delta is calculated
Delta is calculated by subtracting the volume traded at the bid from the volume traded at the ask.
Market orders are treated as aggressive because they fill immediately, and limit orders are treated as passive because they wait to be filled.
Aggressive orders and passive orders
That distinction is the whole basis of the reading. A resting limit order sits in the book and waits for someone to come to it. A market order doesn't wait—buying at the ask or selling at the bid fills straight away, and paying the spread to get filled now rather than later implies urgency. Delta counts that urgency and assigns it a side: market buy orders minus market sell orders. A positive result means aggressive buyers did more volume over the period than aggressive sellers.
Why complete bid-ask volume is possible in futures
Futures trade on a centralized exchange, so the bid-ask split behind every fill is recorded in one place. CME Group data carries the whole picture rather than a share of it, which is why you can calculate delta cleanly here and not across fragmented equity venues. That's a data-structure point rather than a trading edge, but it's why you can trust the number as a count.
What it meansIf cumulative delta climbs steadily through a session while price barely moves, aggressive buyers have been paying up to get filled and something has been meeting them at size. That's a different market from a quiet drift on thin participation, and a single bar's delta won't show you the difference.
That running total plots two ways.
Session vs. Bar: two ways cumulative delta plots
NinjaTrader plots cumulative delta in two display modes: Session and Bar.
Session mode accumulates delta across the whole trading session and carries each bar's close to the next bar's open; Bar mode resets each bar to zero so the delta of each individual bar is read on its own.
| Display mode | How it accumulates | What a trader uses it for |
|---|---|---|
| Session | Delta accumulates across the trading session. Each bar's close carries to the next bar's open, so the series plots much like a candlestick chart. | Tracking net pressure across a whole session, and reading divergence against price over hours rather than minutes. |
| Bar | Each bar opens at zero and accumulates only its own delta, plotting more like a histogram. Each cumulative delta bar corresponds to the price bar directly above it. | Picking out reversals and sudden changes in order flow activity at the level of the individual bar. |
Cumulative delta plots in its own panel below the price data, so the two series are read against each other, each in its own panel. Switching display mode changes the shape of the panel, not the underlying arithmetic.
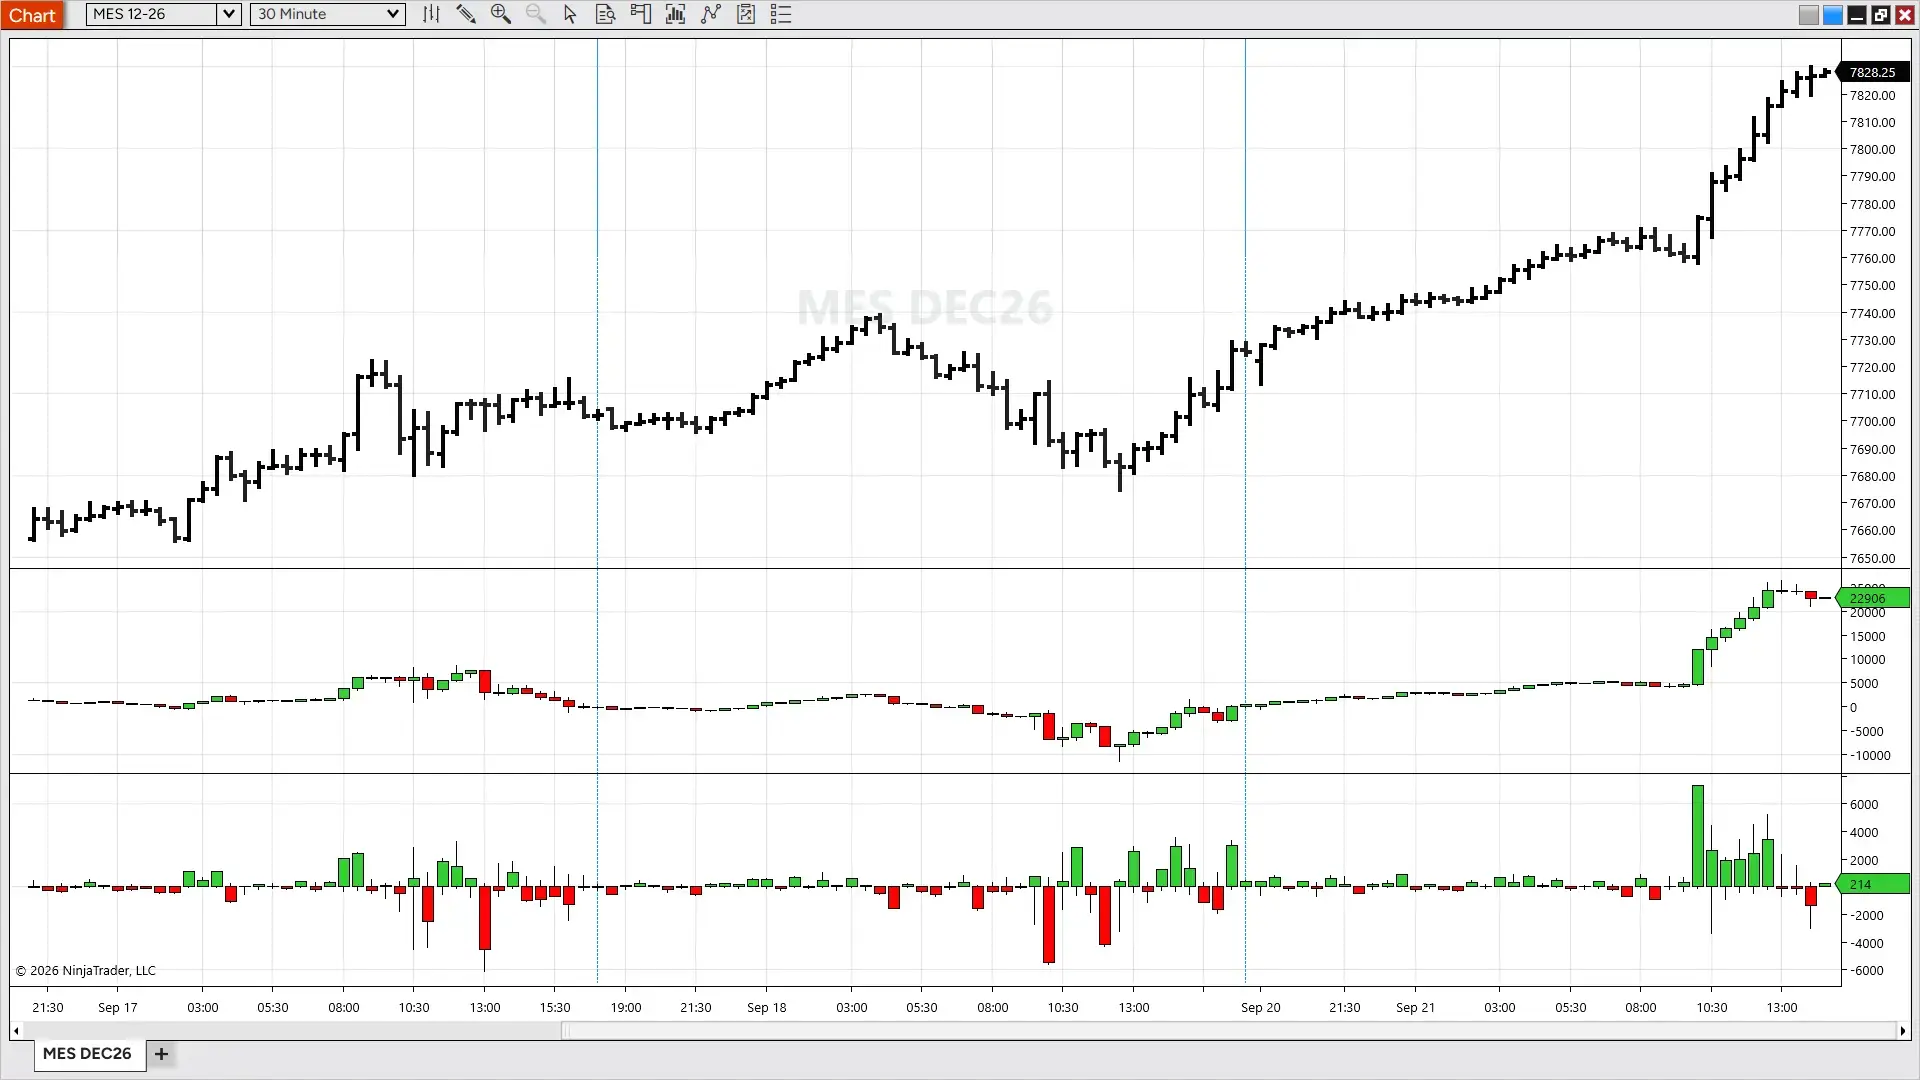
Any trading symbols, company names, logos, or trademarks displayed are used for illustrative purposes only and remain the property of their respective owners. Their use does not imply affiliation with, endorsement by, or sponsorship of NinjaTrader, nor do any trading symbols displayed constitute investment advice or recommendations.
When Session mode helps
Session mode is the setting for questions about the day as a whole. Has aggressive buying been the dominant force since the open? Did the balance flip at the European close and never flip back? Because the line is continuous, the shape of the session is visible at a glance, and any disagreement between that shape and the price chart above it stands out.
When Bar mode helps
Bar mode strips the history away and asks a narrower question of every bar in turn. A single outsized bar against the prevailing direction is easy to miss inside a continuous line and hard to miss in a histogram, which makes this the setting traders reach for when watching for a reversal or a sudden change in activity at a particular level.
Whichever mode is on screen, the readings traders take from it fall into a handful of recognizable patterns.
How to read cumulative delta on a futures chart
Cumulative delta is used to confirm or deny what the price chart appears to be saying.
Charted price may suggest a bullish trend while the delta series fails to back that bias, and noticing the mismatch is most of the value.
Trend confirmation
The straightforward read is agreement. Price grinds higher and cumulative delta grinds higher with it, which says aggressive buyers have been doing the work rather than the move resting on thin selling. Agreement is not a signal to act on by itself, but its absence is worth noticing, and that absence has a name.
Cumulative delta divergence
Cumulative delta divergence occurs when price and cumulative delta move in opposite directions—for example, price sets a new high while cumulative delta sets a lower high. Traders read this as a sign that the aggressive side driving price is weakening, though it's a reactive signal rather than a prediction.
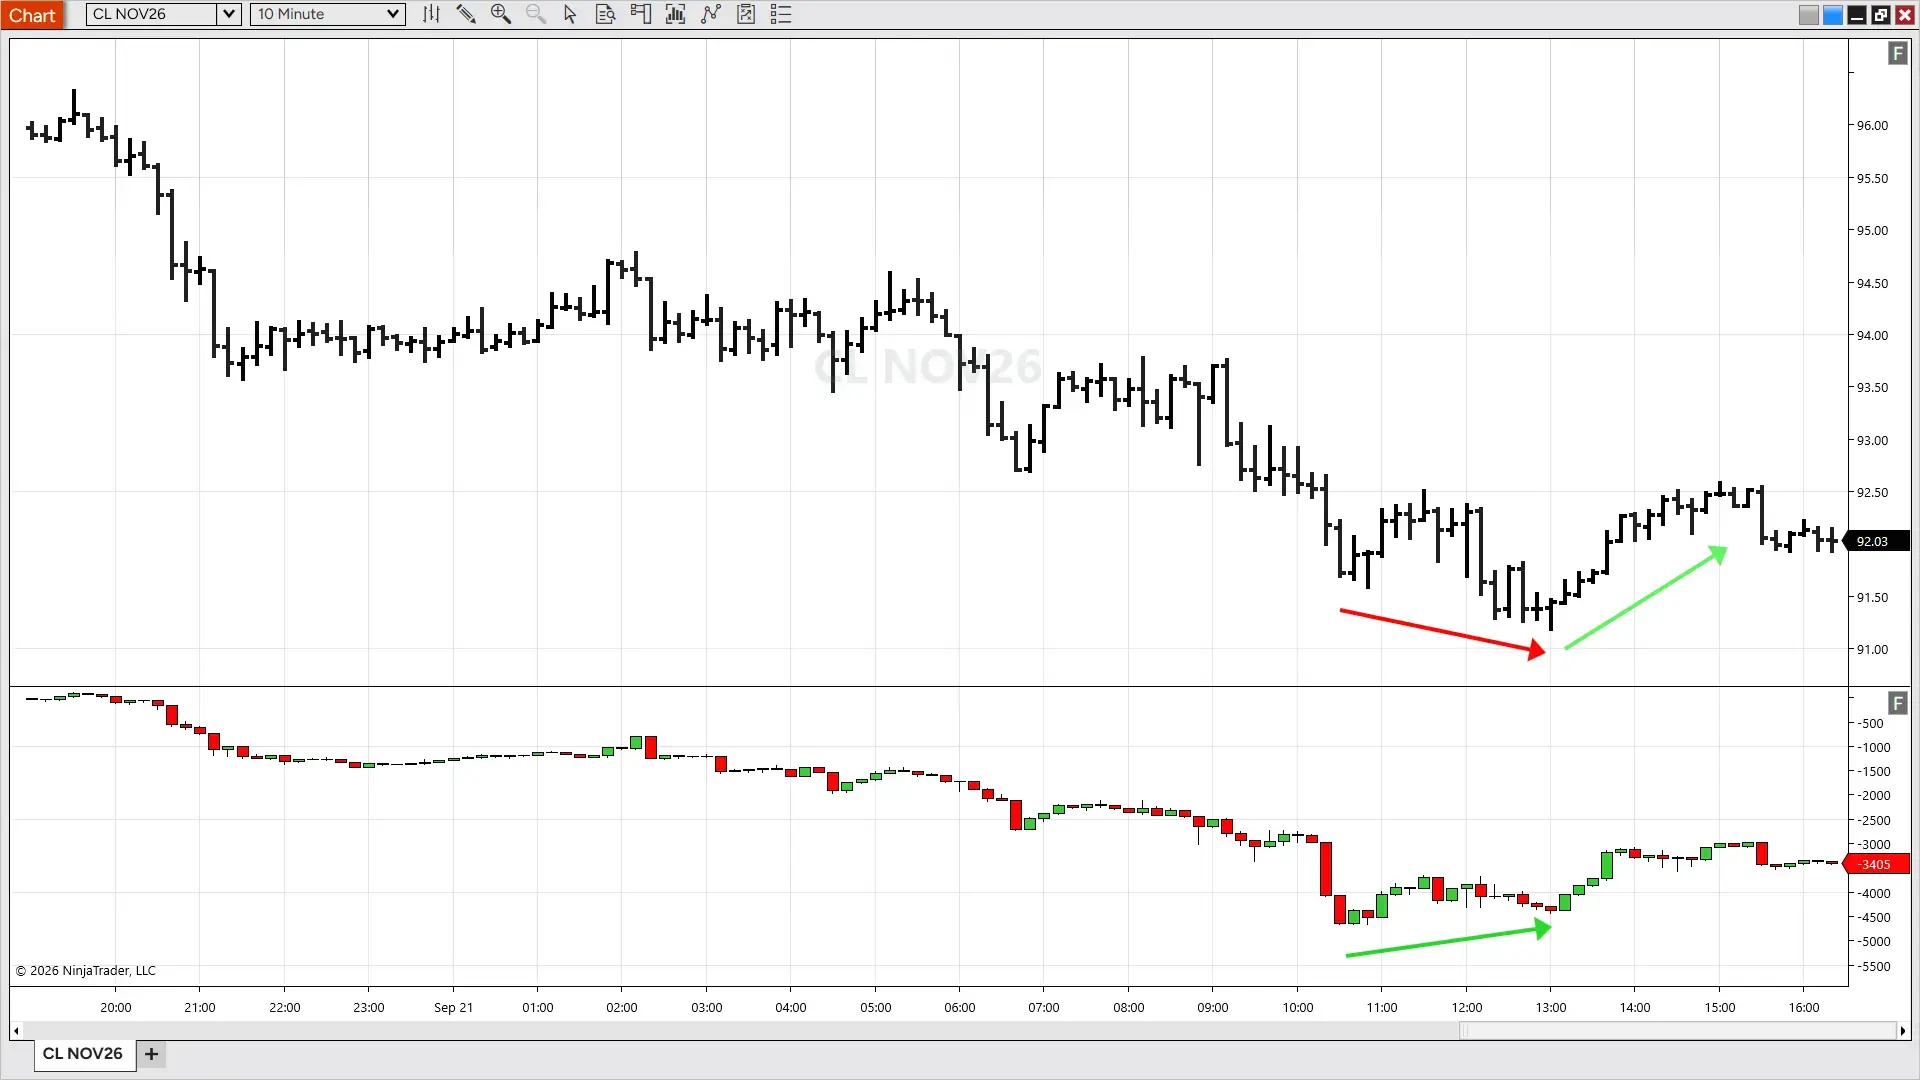
The clearest worked example runs the other way round. Price puts in a new low, while cumulative delta over the same stretch puts in a higher low. Aggressive selling has not followed price down, which traders read as a potentially bullish sign. For someone already long, it can be a reason not to be shaken out of a position by what turns out to be a headfake. For someone flat, it can be one input among several behind initiating a long.
Absorption at a level
Absorption describes heavy volume that fails to move price. Aggressive orders keep hitting one side, delta keeps accumulating, and price stays put because passive limit orders are being filled as fast as the aggressors arrive. Read on its own mechanics, it says that resting size at that level has so far been enough to hold it. The same reading is one of the confirmations traders use when working through liquidity traps, where a move through an obvious level reverses quickly.
Cumulative delta is reactive, not predictive. It counts what's already been traded, so it describes the market that has just happened rather than the one about to. Cumulative delta can also produce false signals, the same as any technical indicator, and divergences that resolve in the trader's favor and those that simply keep going look identical at the moment they appear. Risk management remains paramount.
What it meansTreat a divergence as a reason to look harder at a level, not as an entry on its own. The trader who pairs it with a defined stop and a plan for being wrong is using it the way it can be used.
Reading it well also means knowing what the neighboring tools already cover.
Cumulative delta vs. volume and footprint charts
Volume, footprint delta, and cumulative delta answer three different questions about the same trades.
Running them together is common; expecting one to do another's job is where the confusion usually starts.
| Reading | What it shows | What it does not show |
|---|---|---|
| Volume | How much traded over a bar or a session. | Which side was the aggressor, and whether that pressure built or faded. |
| Footprint (volumetric bars) | Delta broken out per price level inside each bar. | How the balance carried from one bar to the next. |
| Cumulative delta | The running net total of aggressive buying against aggressive selling. | Where inside a bar the imbalance sat. |
Volume against cumulative delta
A tall volume bar is neutral about direction. Tens of thousands of contracts changing hands tells you activity was heavy and nothing about who was chasing. Cumulative delta puts a sign on that activity and then keeps a running score, which is why the two are usually read one after the other. Volume profile adds a third view again, distributing that volume across price to show where the session actually did its business.
Where footprint charts end and the cumulative series begins
Footprint charts, which NinjaTrader calls volumetric bars, own the inside of the bar. They show bid and ask volume at every price level, which is where imbalance and absorption are visible in detail, and our footprint charts guide covers reading them properly.
Cumulative delta owns the other axis: the tally across bars, sessions, and hours. Using the two together is the ordinary case, and our walkthrough of how to read order flow with NinjaTrader shows the combined workflow on a live chart.
All of it runs inside the same feature set.
How to use cumulative delta in NinjaTrader
Cumulative delta is part of NinjaTrader's Order Flow+ feature set—alongside footprint charts (volumetric bars), volume profile, order flow VWAP, and the market depth map—and it runs on centralized CME Group futures data.
Where the indicator sits
Cumulative delta is added to a chart as an indicator and draws in a panel below the price data. The Session and Bar display modes described above are a setting on that indicator, so switching between them takes a moment and does not require a second chart. Session suits ongoing context, and Bar suits watching a particular level.
Getting access to Order Flow+
Order Flow+ is one of the premium feature add-ons included with a NinjaTrader Lifetime plan. Across every plan, adding funds to your live account is what unlocks add-ons like Order Flow+ along with real-time market data, and all plans require a funded, approved live account before those benefits become active. Current NinjaTrader pricing carries the plan detail. Brokerage accounts are held with NinjaTrader Clearing, LLC, which is registered with the Commodity Futures Trading Commission (CFTC) as a futures commission merchant and is a National Futures Association (NFA) Member.
Practicing the read
Reading cumulative delta well takes screen time, and a sim environment lets you practice without risking capital. Watch a divergence form and then resolve, over and over, across different sessions and instruments. That repetition can build your pattern recognition faster than any explanation.
Simulated trading does not represent actual trading and is based on hypothetical conditions. Actual trading results may differ significantly due to factors such as market conditions, liquidity, execution, and the emotional and psychological impact of risking real money. Simulated trading is provided for educational and platform-familiarization purposes only and should not be relied upon as an indication or expectation of results in a live trading environment.
Ready to get started? Open a NinjaTrader account today.
FAQs on cumulative delta
What is cumulative delta?
Cumulative delta, also called cumulative volume delta (CVD), is a running tally of the net difference between aggressive buying volume and aggressive selling volume in a futures market. Positive cumulative delta means buyers have been the more aggressive side over the period measured; negative means sellers have.
How do you read cumulative delta?
Cumulative delta is read against price. When the two move together, aggressive orders are backing the move. When they move apart, which traders call divergence, the aggressive side driving price may be weakening. Cumulative delta is reactive rather than predictive, and it can produce false signals like any technical indicator, so it's best used as one input alongside a defined risk plan.
What's the difference between cumulative delta and volume?
Volume counts how many contracts traded and says nothing about which side initiated. Cumulative delta subtracts volume traded at the bid from volume traded at the ask and keeps a running total, so it assigns a direction to that activity. A session can carry heavy volume and a flat cumulative delta, which means aggressive buyers and aggressive sellers were roughly matched.
What does cumulative delta divergence mean?
Cumulative delta divergence occurs when price and cumulative delta move in opposite directions—for example, price sets a new high while cumulative delta sets a lower high. Traders read this as a sign that the aggressive side driving price is weakening, though it's a reactive signal rather than a prediction.
Is cumulative delta the same as cumulative volume delta (CVD)?
Yes. NinjaTrader labels the indicator cumulative delta, while much of the wider order flow field writes cumulative volume delta (CVD). The calculation behind both terms is identical: volume traded at the ask minus volume traded at the bid, accumulated over time.