A fair value gap (FVG) is a 3-candle price-action pattern where the wick of the first candle and the wick of the third candle don't overlap, leaving a price range with no two-sided trade activity, commonly called an imbalance. Futures traders use these gaps to flag areas where price moved so fast that buyers and sellers never really met, and where price often swings back before continuing its original move.
This guide covers what a fair value gap looks like, how to draw one on your chart, how traders build entries and stops around it, and how NinjaTrader's built-in Fair Value Gap indicator can help you spot these setups without drawing every zone by hand.
What is a fair value gap?
A fair value gap forms when a market moves aggressively enough that price skips over a range without two-sided trading. That skipped range becomes a zone traders watch for a potential return visit.
The 3-bar definition (the textbook FVG pattern)
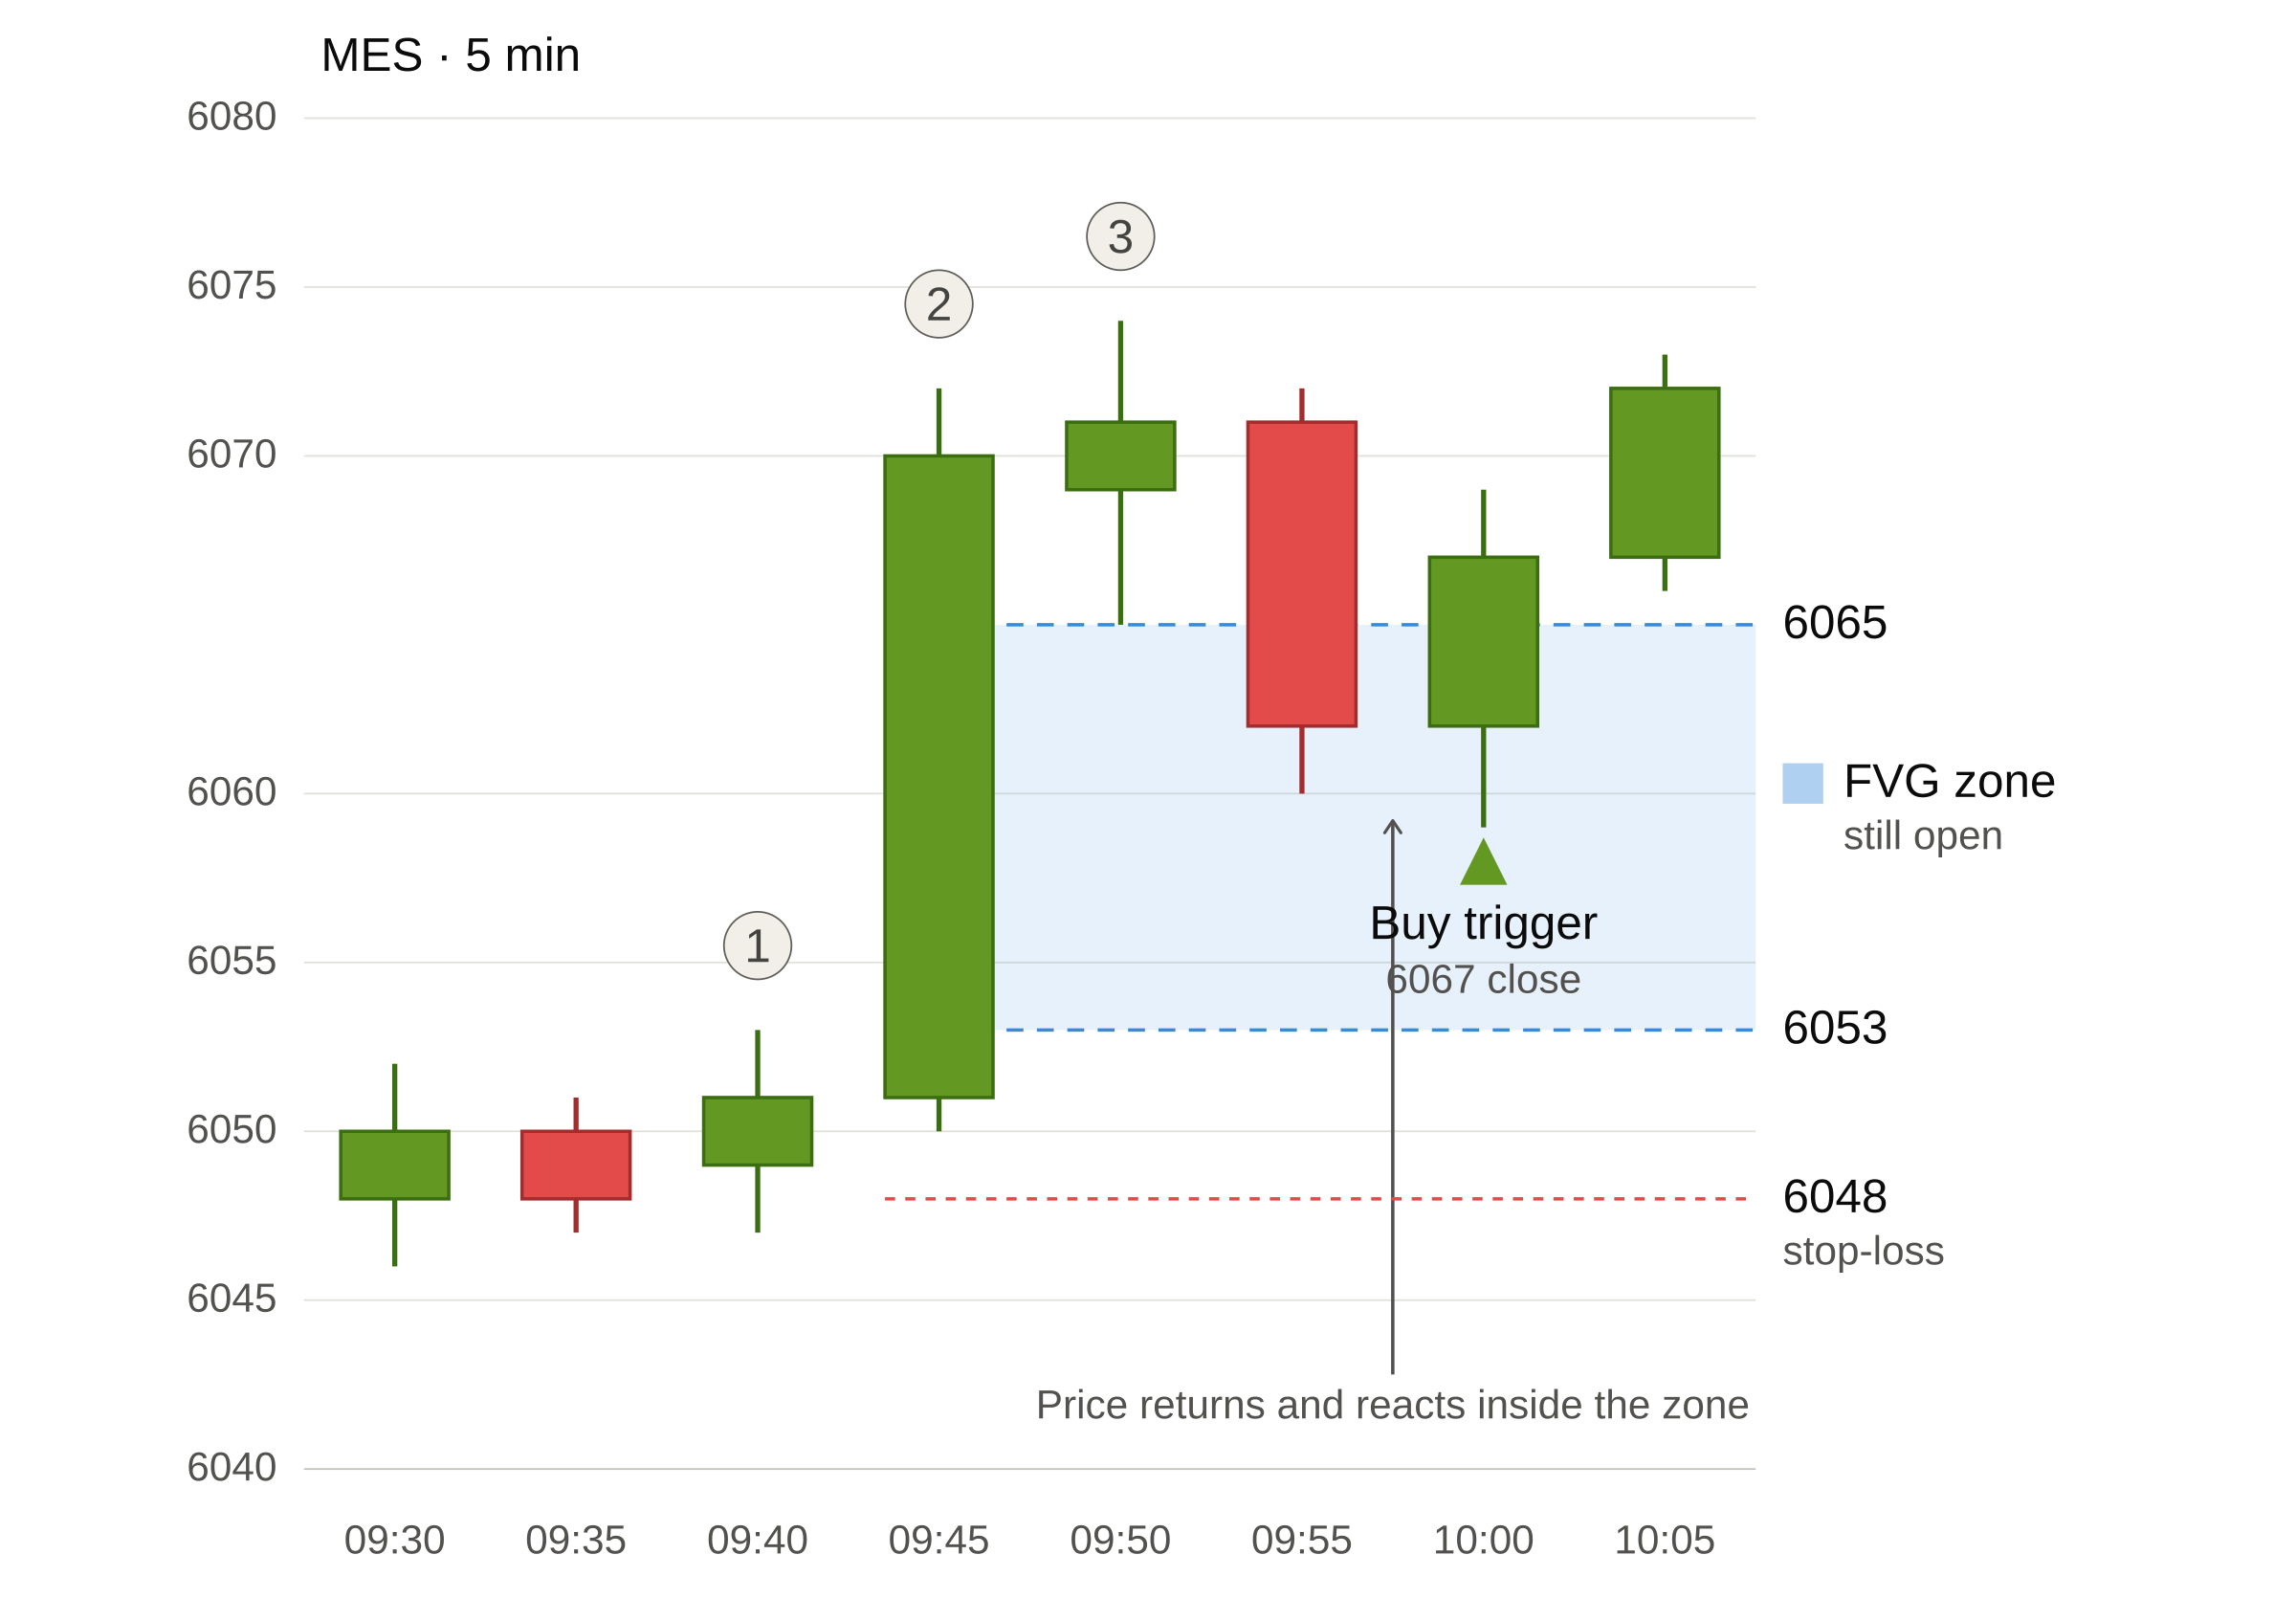
The textbook fair value gap uses three consecutive candles. The middle candle does the heavy lifting: it's the displacement candle, the one that moves fast and far enough to create the gap. Compare the wick of the first candle to the wick of the third candle. If they don't overlap, the space between them is the fair value gap.
The gap itself isn't the middle candle, it's the untouched price range between candle one and candle three, sitting behind the move.
Bullish vs bearish fair value gaps
A bullish fair value gap forms during a strong upward move when the high of the first candle is lower than the low of the third candle; a bearish fair value gap forms during a strong downward move when the low of the first candle is higher than the high of the third candle. The direction of the displacement candle tells you which side of the market created the imbalance.
| Criteria | Bullish FVG | Bearish FVG |
|---|---|---|
| Formation | Forms during a strong upward move | Forms during a strong downward move |
| Gap location | Below the displacement candle, above candle one's high | Above the displacement candle, below candle one's low |
| Directional bias | Often treated as potential support | Often treated as potential resistance |
| Typical reaction traders watch for | Price dips back into the zone before continuing higher | Price rallies back into the zone before continuing lower |
Bullish and bearish FVGs are mirror images of each other. The label just tells you which direction the move that created the gap was headed, and which side of the zone traders expect to act as support or resistance.
Why FVGs form (imbalance and aggressive order flow)
Fair value gaps show up when order flow gets one-sided in a hurry. A wave of aggressive buying or selling can push price through a range so quickly that resting orders never get a chance to trade at every price along the way, leaving what's known as an imbalance. You can see this dynamic in more detail in NinjaTrader's guide on order imbalance in futures markets, which breaks down how one-sided order flow can create a trading edge.
Fair value gaps are really just a visual signature left behind by that imbalance, one you can spot on a plain candlestick chart without any order flow tools at all.
Understanding why a gap formed sets up the next step: learning how to find and draw one on your own chart.
How to identify a fair value gap on a chart
Once you know the 3-bar structure, spotting a fair value gap comes down to drawing the zone correctly and choosing the right timeframe to watch it on.
Drawing the zone from the wicks
To draw a bullish FVG, mark a box from the high of the first candle's wick to the low of the third candle's wick. For a bearish FVG, mark a box from the low of the first candle's wick to the high of the third candle's wick. That box is the zone you'll track for a potential return visit.
Common timeframes for FVG analysis (1-minute, 5-minute, hourly, daily)
Fair value gaps can form on any timeframe, from a 1-minute chart to a daily chart, and the timeframe you choose changes how the gap behaves. Lower timeframes like the 1-minute and 5-minute produce more gaps, but many fill quickly and carry less weight. Hourly and daily gaps form less often, yet they tend to hold up as support or resistance for longer. For a broader look at reading candles and structure across timeframes, see NinjaTrader's guide to price action trading strategies.
Confirming the gap is "live" vs already filled
A fair value gap is considered "live" until price trades back through it. Once a candle closes through the zone, the gap is marked filled, and traders generally stop treating it as an active support or resistance level. Checking whether a gap is live or filled before you build a trade plan around it can help you avoid chasing a level the market has already resolved.
With the zone drawn and its status confirmed, the next question is how to actually plan a trade around it.
Trading the fair value gap
Spotting a fair value gap is the easy part. Turning a fair value gap into a trade means answering four questions before you click a single button: why price should return, where you'd get in, where you're wrong, and where you'd take profit.
The "return-to-fill" thesis
Traders treat fair value gaps as potential support or resistance zones because price often returns to fill the imbalance before continuing in the direction of the prior move. That's the core thesis behind most FVG strategies: the gap acts like a magnet in the short term, even as the broader trend stays intact.
A return-to-fill move isn't a reversal signal on its own. It's simply price revisiting an area it skipped over, and the reaction it gets there is what traders use to plan an entry.
Entry triggers inside the gap
Rather than buying or selling the instant price touches the edge of the zone, many traders wait for a reaction inside the gap, such as a rejection wick, a slowdown in momentum, or a shift on a footprint or order flow chart. Some traders scale into the zone in pieces instead of committing size at a single price.
Stop placement above or below the displacement candle
A common approach places the stop-loss order just beyond the high or low of the displacement candle that created the gap. That level marks the point where the original thesis, that the imbalance would hold as support or resistance, is proven wrong.
Defining a realistic target (next swing, opposing FVG, prior daily high/low)
Reasonable targets for a fair value gap trade include the next visible swing high or low, an opposing fair value gap sitting further along the chart, or the prior day's high or low. Setting a take-profit order at one of these levels can help you lock in gains before price reaches a level where the move is more likely to stall.
A defined entry, stop, and target can turn a fair value gap from a chart pattern into an actual trade plan.
Fair value gaps and confluence
A fair value gap by itself is just a shape on a chart. Line it up with these other signals, and it starts to carry real weight.
Pairing FVGs with order flow, footprint, and volume profile
Fair value gaps carry more weight when order flow data backs them up. A footprint chart can show whether aggressive buying or selling actually drove the imbalance, while a volume profile indicator can reveal whether the gap sits inside a low-volume node, an area with little historical trading interest, which tends to fill faster. For a deeper look at reading order flow, see NinjaTrader's guides on footprint charts, order flow trading, and order flow trading with volumetric bars.
FVGs at higher-timeframe support and resistance
A fair value gap that lines up with an existing support or resistance level from a higher timeframe carries more significance than one sitting in open air. Traders often cross-reference FVGs on a lower timeframe against key levels identified on a higher timeframe first. NinjaTrader's guide on identifying intraday support and resistance levels walks through how to map those levels before layering FVGs on top.
Combining FVGs with prior-day OHLC and VWAP
Prior-day open, high, low, and close (OHLC) levels and the volume-weighted average price (VWAP) give traders another layer of confluence to check against a fair value gap. Fair value gaps are most reliable when they align with higher-timeframe support and resistance, prior-day OHLC, VWAP, or visible order flow imbalance on a footprint chart inside the NinjaTrader platform. When several of these signals point to the same zone, that level deserves more attention than a gap standing alone.
Layering order flow, structure, and VWAP on top of a fair value gap can help you separate the setups worth watching from the ones better left alone.
Common mistakes when trading fair value gaps
Mistake 1: Treating every gap as tradable
Not every fair value gap deserves a trade. Small gaps on a low timeframe, or gaps that form in a choppy, directionless market, often fill quickly and offer little edge. Filtering for gaps that align with a clear trend or a higher-timeframe level can help you avoid taking every setup that appears on the chart.
Mistake 2: Ignoring the higher-timeframe trend
A fair value gap that fights the broader trend is a lower-probability setup than one trading with it. NinjaTrader's guide on trading trend reversals in futures covers how to recognize when a market is genuinely turning versus pausing, a distinction worth checking before you lean on an FVG against the prevailing move.
Mistake 3: Sizing without a defined invalidation
Entering a fair value gap trade without a clear stop-loss order in place leaves you exposed if the zone fails to hold. Define your invalidation level, typically just beyond the displacement candle, before you size the position, not after.
Most fair value gap mistakes come down to skipping a filter, whether that's trend direction, timeframe, or a defined stop, so building a simple checklist before every trade can help you stay consistent.
Using the fair value gap indicator inside NinjaTrader
You don't have to draw every gap by hand. NinjaTrader's Fair Value Gap (FVG) indicator does the spotting for you, so you can focus on the decision.
Where to find the FVG indicator in the help library
NinjaTrader Desktop includes an official Fair Value Gap indicator that detects 3-bar imbalances, plots the gap zone, and marks the FVG as filled when price closes through the gap. You'll find full setup instructions in our Fair Value Gap indicator help article.
How to configure lookback and fill behavior
The indicator lets you set a lookback period that controls how many bars back it scans for new gaps, along with settings for how a filled gap is displayed once price trades through it. Adjusting these settings can help you match the indicator's behavior to the timeframe and instrument you're trading.
Practicing FVG setups in the NinjaTrader simulator
Before risking live capital on fair value gap setups, you can practice spotting and trading them in NinjaTrader's trading simulator, a sim environment that lets you test entries, stops, and targets against real market data risk-free.
Simulated Trading Disclosure: Simulated trading is hypothetical and does not reflect actual trading or real-world results.
NinjaTrader's Fair Value Gap indicator can help you find and track these zones automatically, so you can spend more time refining your entries and less time drawing boxes by hand.
Ready to put fair value gaps to work in your own trading?
FAQs about fair value gaps
Quick answers to the questions traders ask most about fair value gaps.
A fair value gap (FVG) is a 3-candle price-action pattern where the wick of the first candle and the wick of the third candle don't overlap, leaving a price range with no two-sided trade activity, commonly referred to as an imbalance. Traders watch these zones for a potential return visit before price continues in its original direction.
Most traders wait for price to return to the gap, look for a reaction inside the zone, and place a stop-loss order beyond the displacement candle that created it. From there, a target can be set at the next swing level, an opposing fair value gap, or the prior day's high or low.
A bullish fair value gap forms during a strong upward move and is treated as potential support, while a bearish fair value gap forms during a strong downward move and is treated as potential resistance. Both follow the same 3-bar structure; only the direction of the displacement candle differs.
Yes. NinjaTrader Desktop includes an official Fair Value Gap indicator that detects 3-bar imbalances, plots the gap zone, and marks the FVG as filled once price closes through it. You can find setup details in the Fair Value Gap indicator help article.
A fair value gap is marked filled once a candle closes all the way through the zone. NinjaTrader's Fair Value Gap indicator tracks this automatically, so you don't have to check each gap by hand.