Whether you’re just starting your trading journey or refining a seasoned strategy, understanding trading timeframes is essential. The chart interval you choose can shape your trade decisions, impact your level of risk, and align (or clash) with your trading goals. Let’s break down how timeframes work, when to use them, and how to choose the right one for your futures trading strategy.
What is a trading timeframe?
A trading timeframe refers to the length of time each candlestick or bar represents on a chart. Common intervals include minutes (e.g., M1, M3), hours (e.g., H1), and days (e.g., D1), and each provides a different view of market behavior.
Shorter timeframes show more granular price action and are often used by day traders, while longer timeframes are better suited for swing or position trading. Timeframes can help you identify trends, reversals, and opportunities that align with your unique strategies and risk tolerance.
Understanding M1, M3, H1, and beyond
Here’s a quick overview of how different chart timeframes compare:
- M1 (1-minute): Each candle shows one minute of price movement—great for fast-paced scalping strategies
- M3 (3-minute): Offers slightly more stability than M1 while still capturing short-term trends
- M5, M15, M30: Minute-based charts that balance short-term trading with enough historical data to gauge trend direction
- H1 (1-hour): A popular choice for intraday traders wanting a broader perspective without going too long-term
- H4 (4-hour), daily, weekly: Higher timeframes that help clarify long-term trends and minimize noise
Each of these timeframes has pros and cons, depending on how actively you’re trading and what kind of market signals you’re watching for.
When to use short-term timeframes (M1, M3, M5)
Short-term timeframes are commonly used by scalpers and high-frequency day traders. These charts provide quick snapshots of price action and are ideal for capitalizing on small intraday movements. Use short-term charts when you want to:
- Make rapid-fire trades throughout the session.
- Capture volatility during high-impact news releases.
- Enter and exit the market within minutes.
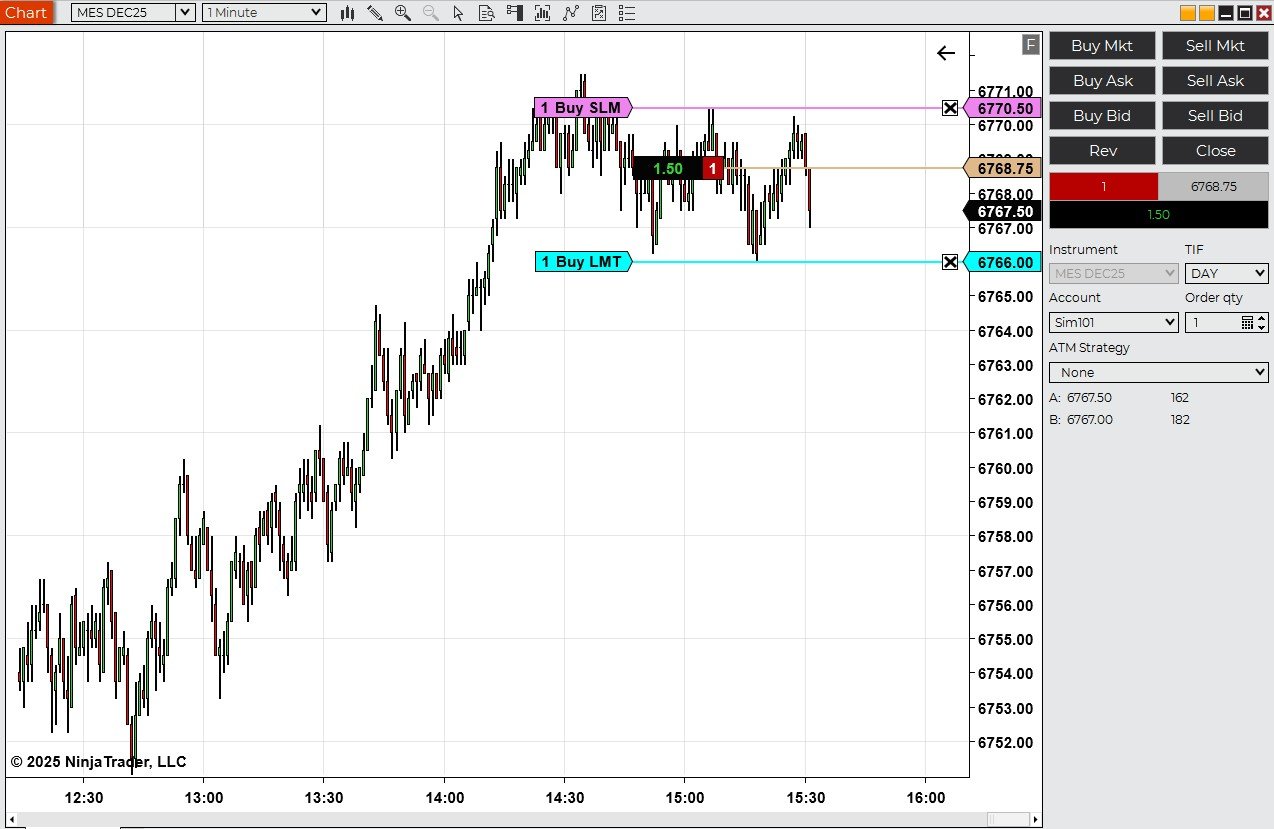 Figure 1: One-minute chart with Chart Trader tools
Pros:
- High number of trade setups
- Greater control over entry and exit timing
Considerations:
- Requires more screen time and fast decision-making
- May involve higher transaction costs and slippage
Short-term charts can help you capitalize on rapid market movements, but they require quick decision-making and close attention throughout the trading day.
When to use medium-term timeframes (M15, M30, H1)
Medium-term timeframes are a popular middle ground for traders who want to participate in multiple trades per day without the intensity of scalping. Use medium-term charts when you want to:
- Trade within the day while avoiding excessive market noise.
- Combine technical analysis with short-term trend direction.
- Look for confirmation signals from higher or lower timeframes.
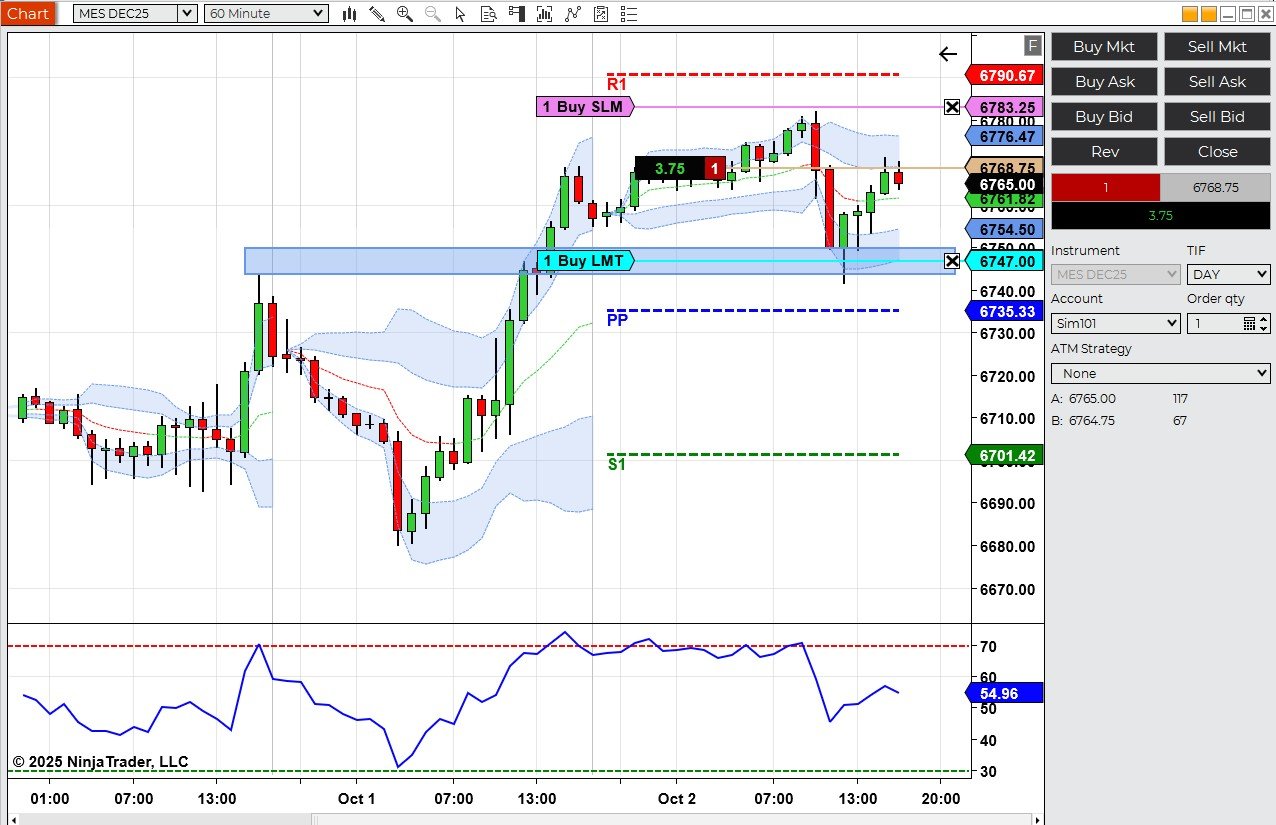 Figure 2: Hourly chart with a mix of order flow and technical indicators
Pros:
- Balanced trade frequency and decision-making time
- Useful for setting defined entry/exit levels and managing risk
Considerations:
- Still sensitive to intraday volatility
- May miss opportunities visible on higher or lower timeframes
Medium timeframes offer a balanced approach if you’re seeking flexibility, allowing for multiple trade setups with less noise than ultra-short intervals.
When to use higher timeframes (H4, daily, weekly)
Higher timeframes are favored by swing traders and long-term strategists. These charts help filter out market noise and reveal broader price patterns. Use higher timeframes when you want to:
- Hold positions for multiple days or weeks
- Identify major support/resistance zones
- Track macroeconomic trends or longer-term momentum
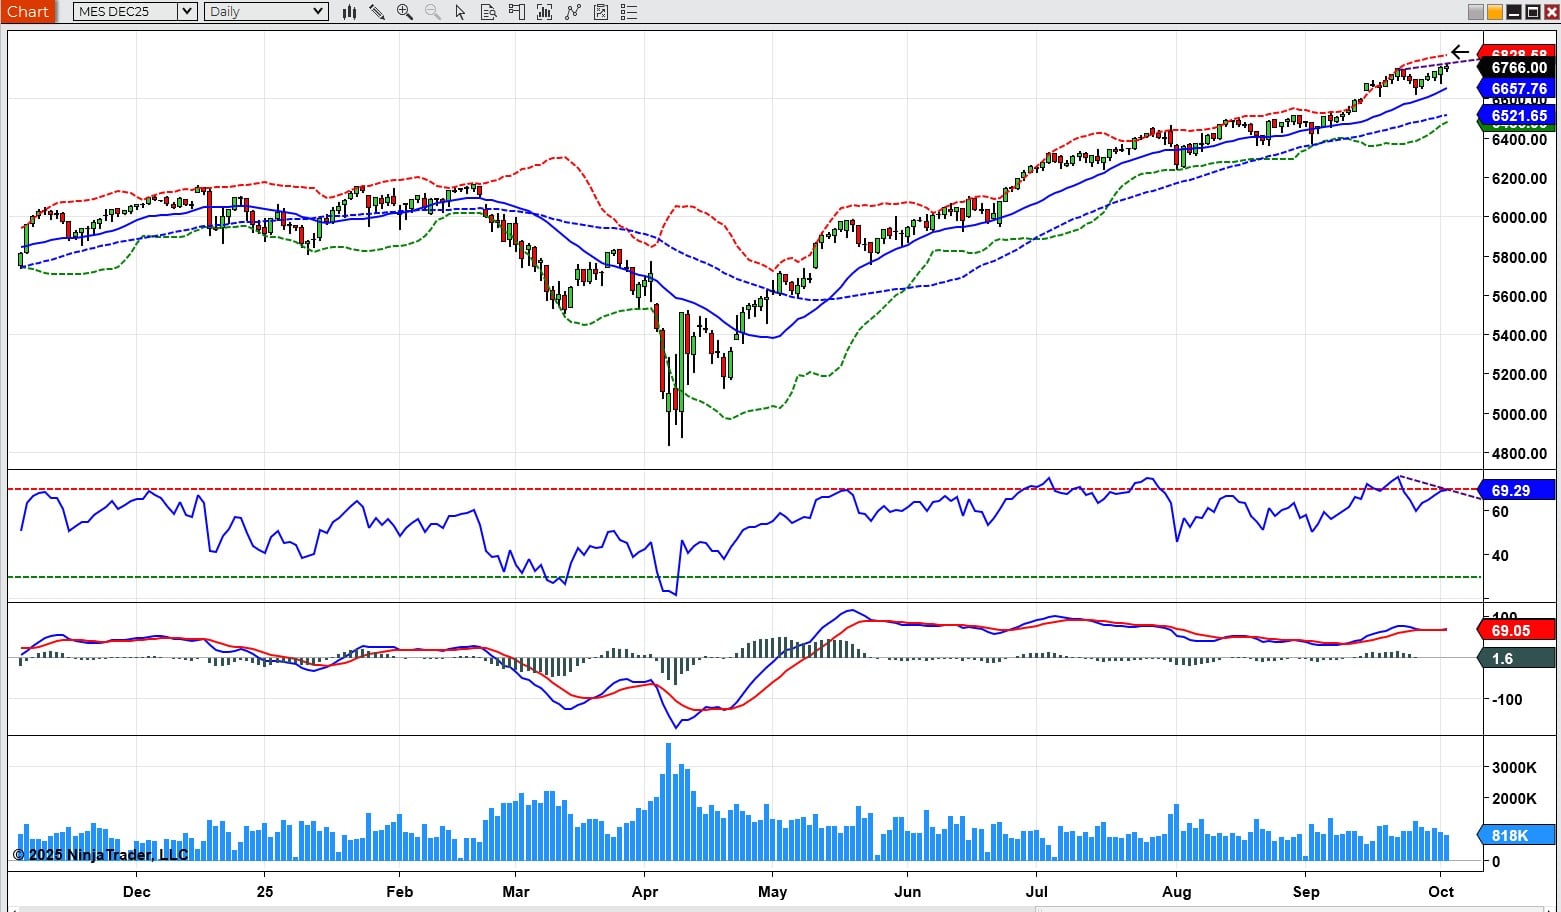 Figure 3: Daily chart with trend, momentum, volume, and volatility indicators
Pros:
- Lower stress and less screen time
- Better signal-to-noise ratio
Considerations:
- Fewer trade opportunities
- Larger stop-loss requirements due to wider price ranges
Higher timeframes can help you focus on long-term trends and reduce trading noise, making them ideal for strategic, less time-intensive trading.
How to combine multiple timeframes in trading
Many experienced traders use multiple timeframe analysis (MTA) to enhance their decision-making. This involves using a longer timeframe to identify the trend, a medium timeframe to find setup zones, and a shorter timeframe to time entries and exits.
Example:
- Use a daily chart to identify the trend.
- Use an H1 chart to locate support/resistance.
- Use an M5 chart to execute the trade.
This top-down approach can help confirm signals and improve trade accuracy by ensuring your entries align with broader market momentum.
Choosing the best timeframe for your strategy
The best trading timeframe for you depends on your personal goals, experience level, and availability to monitor the markets. Here are a few questions to help you decide:
- How much time can you commit to trading each day?
- Do you prefer frequent trades or longer-term positions?
- Are you more comfortable reacting quickly or taking time to analyze?
If you’re just getting started, experimenting with different timeframes in NinjaTrader’s simulated trading environment can help you find what best aligns with your trading style.

Use chart timeframes in your futures trading
No matter how you trade futures, chart timeframes play a central role in helping you interpret market behavior and execute your strategy. NinjaTrader’s award-winning platform offers customizable charting tools, allowing you to easily switch between timeframes, layer multiple indicators, and gain clarity on the market—whether you’re a minute-by-minute scalper or a swing trader analyzing weekly trends.
Open your NinjaTrader account today to try different timeframes in our free sim environment and discover which chart views can help bring your strategy into focus.
