Chart patterns are recognizable price formations on a futures trading chart that traders use to anticipate potential trend reversals or continuations. Learning to spot chart patterns is a core part of technical analysis, and it can help you read price action with more confidence across the futures markets you trade.
Common futures chart patterns include head and shoulders, double tops and bottoms, cup and handle, flags, and pennants. Below, we break down eight patterns worth knowing, with a quick read on what each one suggests and a link to a deeper breakdown where you want more detail. For a hands-on primer, see our guide to identifying chart patterns on futures trading charts.
Before diving in, it helps to know that most patterns fall into one of two groups. Reversal patterns suggest the current trend may be changing direction, while continuation patterns suggest a trend is pausing before it picks back up. Here's a quick side-by-side.
| Reversal patterns | Continuation patterns | |
|---|---|---|
| What they signal | A possible change in the current trend direction | A likely pause before the current trend resumes |
| Common examples | Head and shoulders, double tops and bottoms, key reversals | Flags, pennants, cup and handle |
| How traders often use them | To watch for a potential top or bottom forming | To stay with a trend through a consolidation phase |
With that framework in place, let's walk through the eight patterns and what each can signal.
1. Inside and outside bars
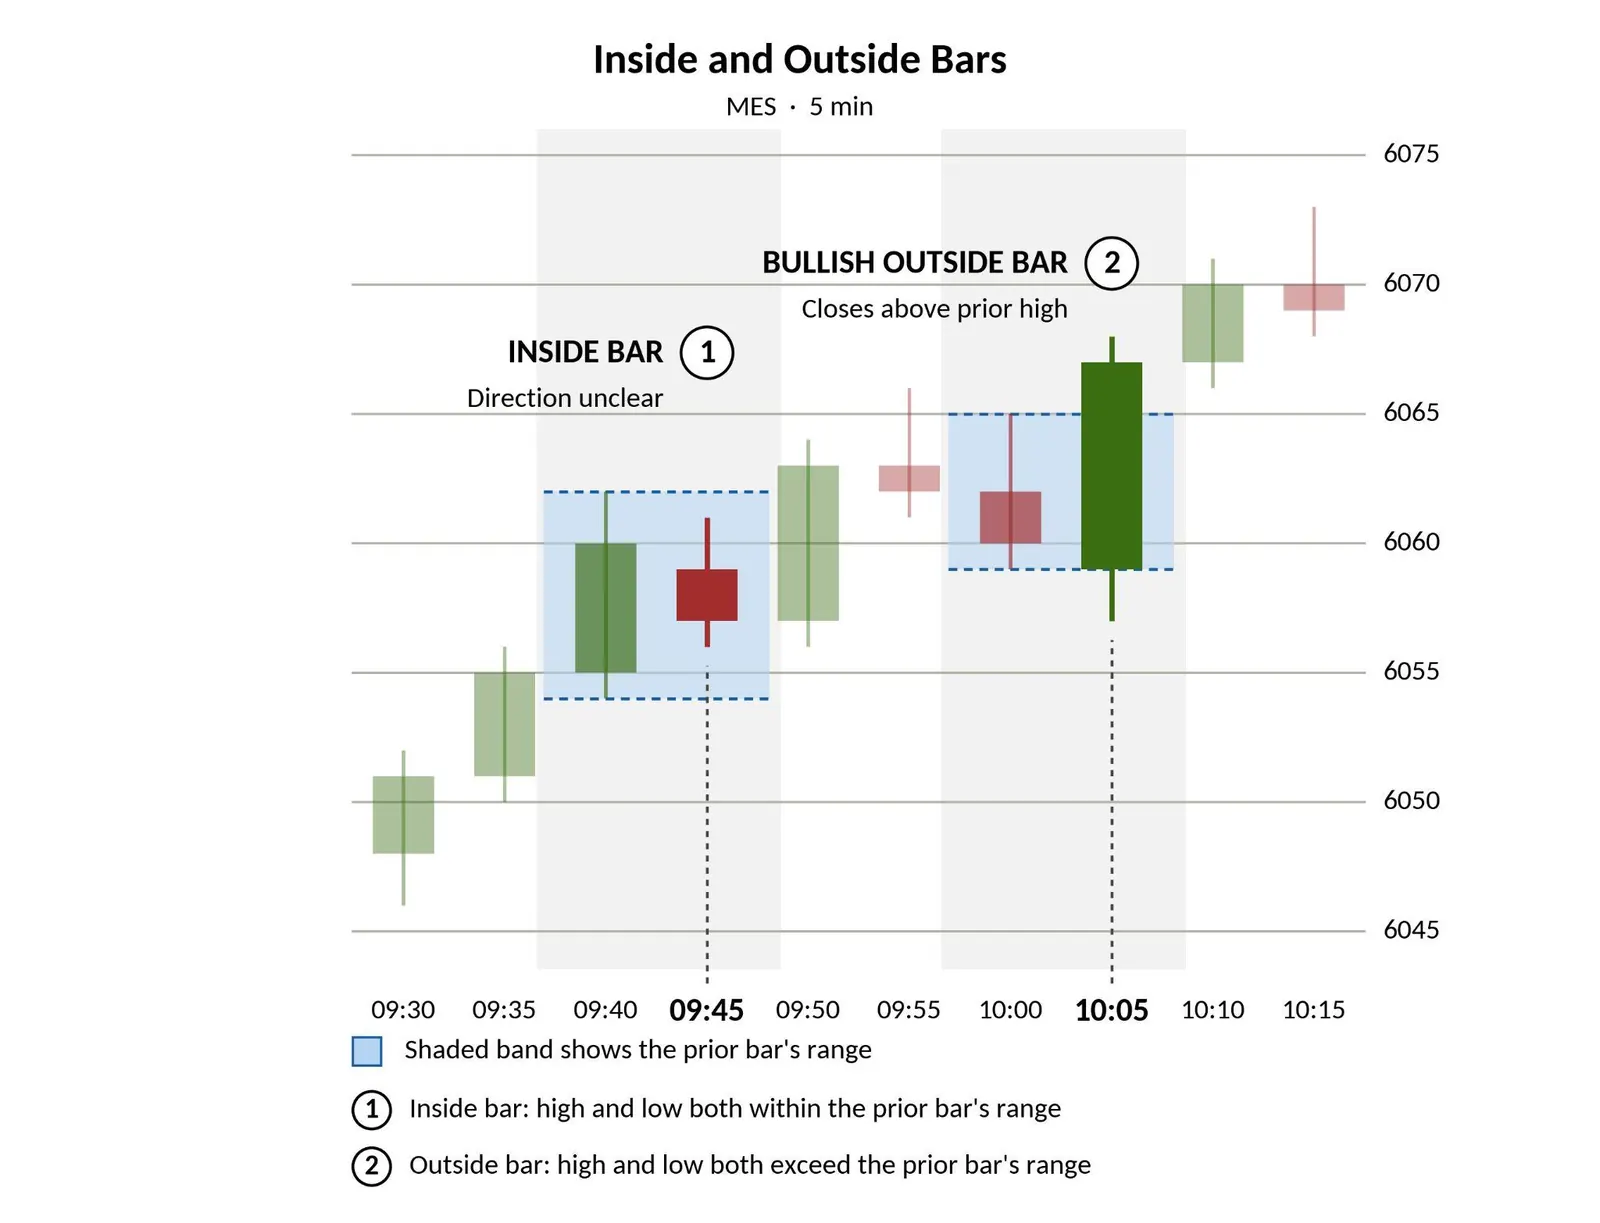
Inside and outside bars are two-bar patterns defined by how one bar's range compares to the bar before it. An inside bar sits entirely within the prior bar's high and low, signaling consolidation, while an outside bar engulfs the prior bar's range, signaling a possible shift in momentum.
An inside bar often points to a market taking a breather, and an outside bar can flag a burst of volatility that traders watch for a potential move.
2. Key reversals
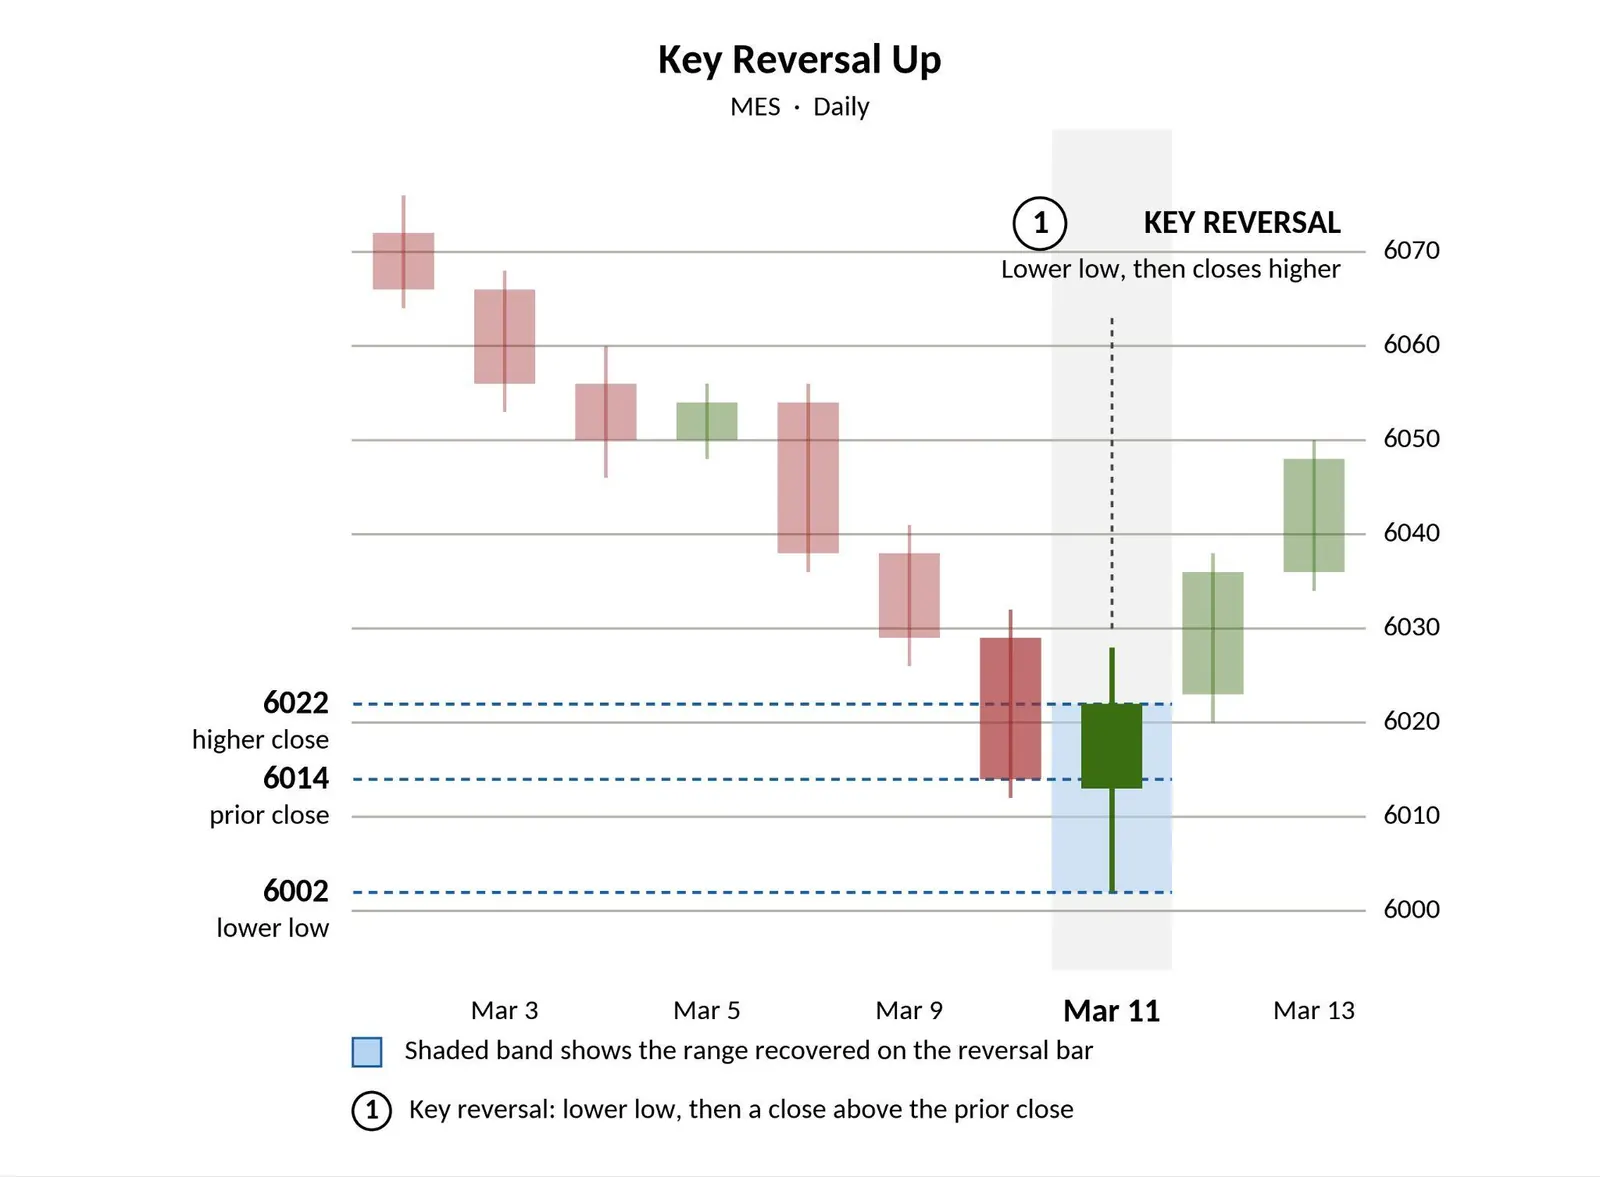
A key reversal is a single-bar pattern where price pushes to a new high or low and then closes back in the opposite direction. It can hint that buyers or sellers have lost control at an extreme, setting up a potential turn in the trend.
A key reversal near the end of a strong move is a signal many traders use to react to a possible top or bottom, not to predict one.
3. Opening gaps
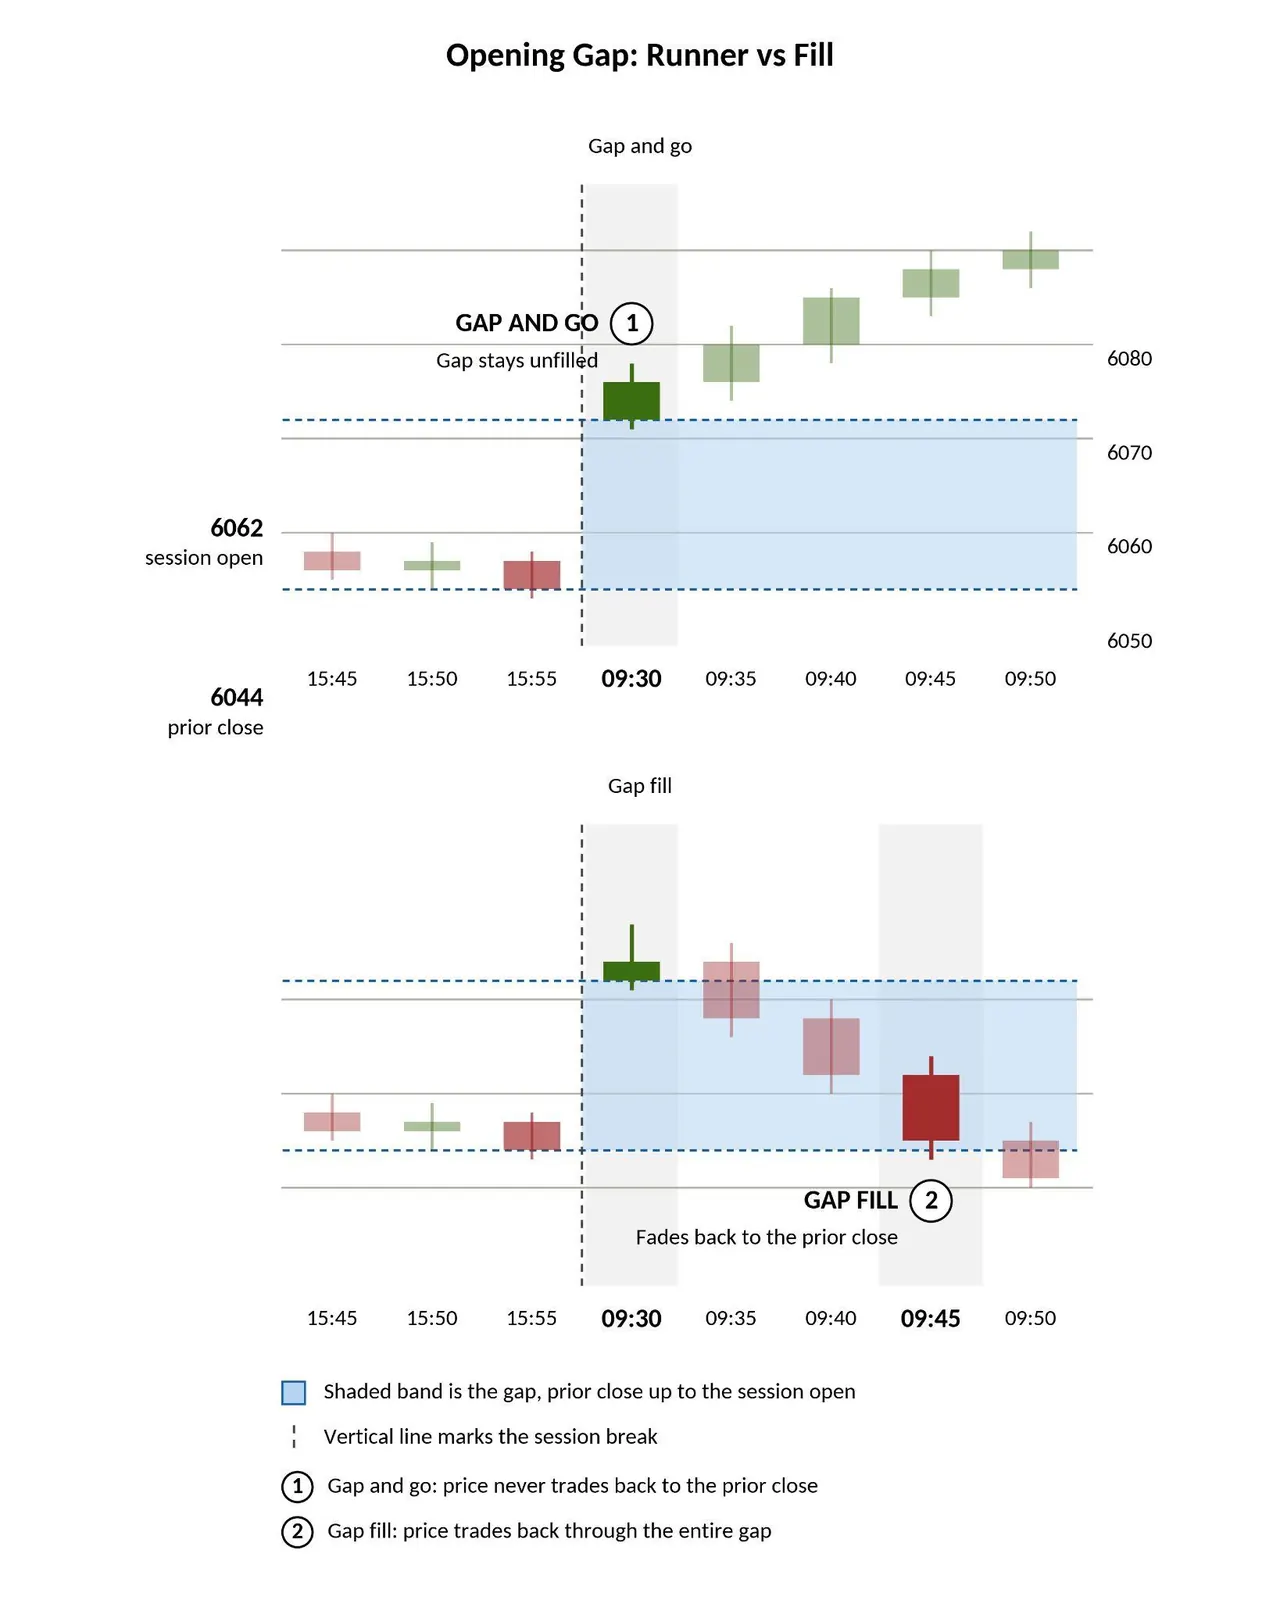
An opening gap forms when a futures contract opens at a noticeably different price than its prior close, leaving an empty space on the chart. Gaps often follow news, economic data, or shifts in overnight sentiment, and traders watch whether price fills the gap or runs with it.
Gaps can mark strong conviction in a direction; a quick gap fill can signal that conviction was short-lived.
4. Double tops and bottoms
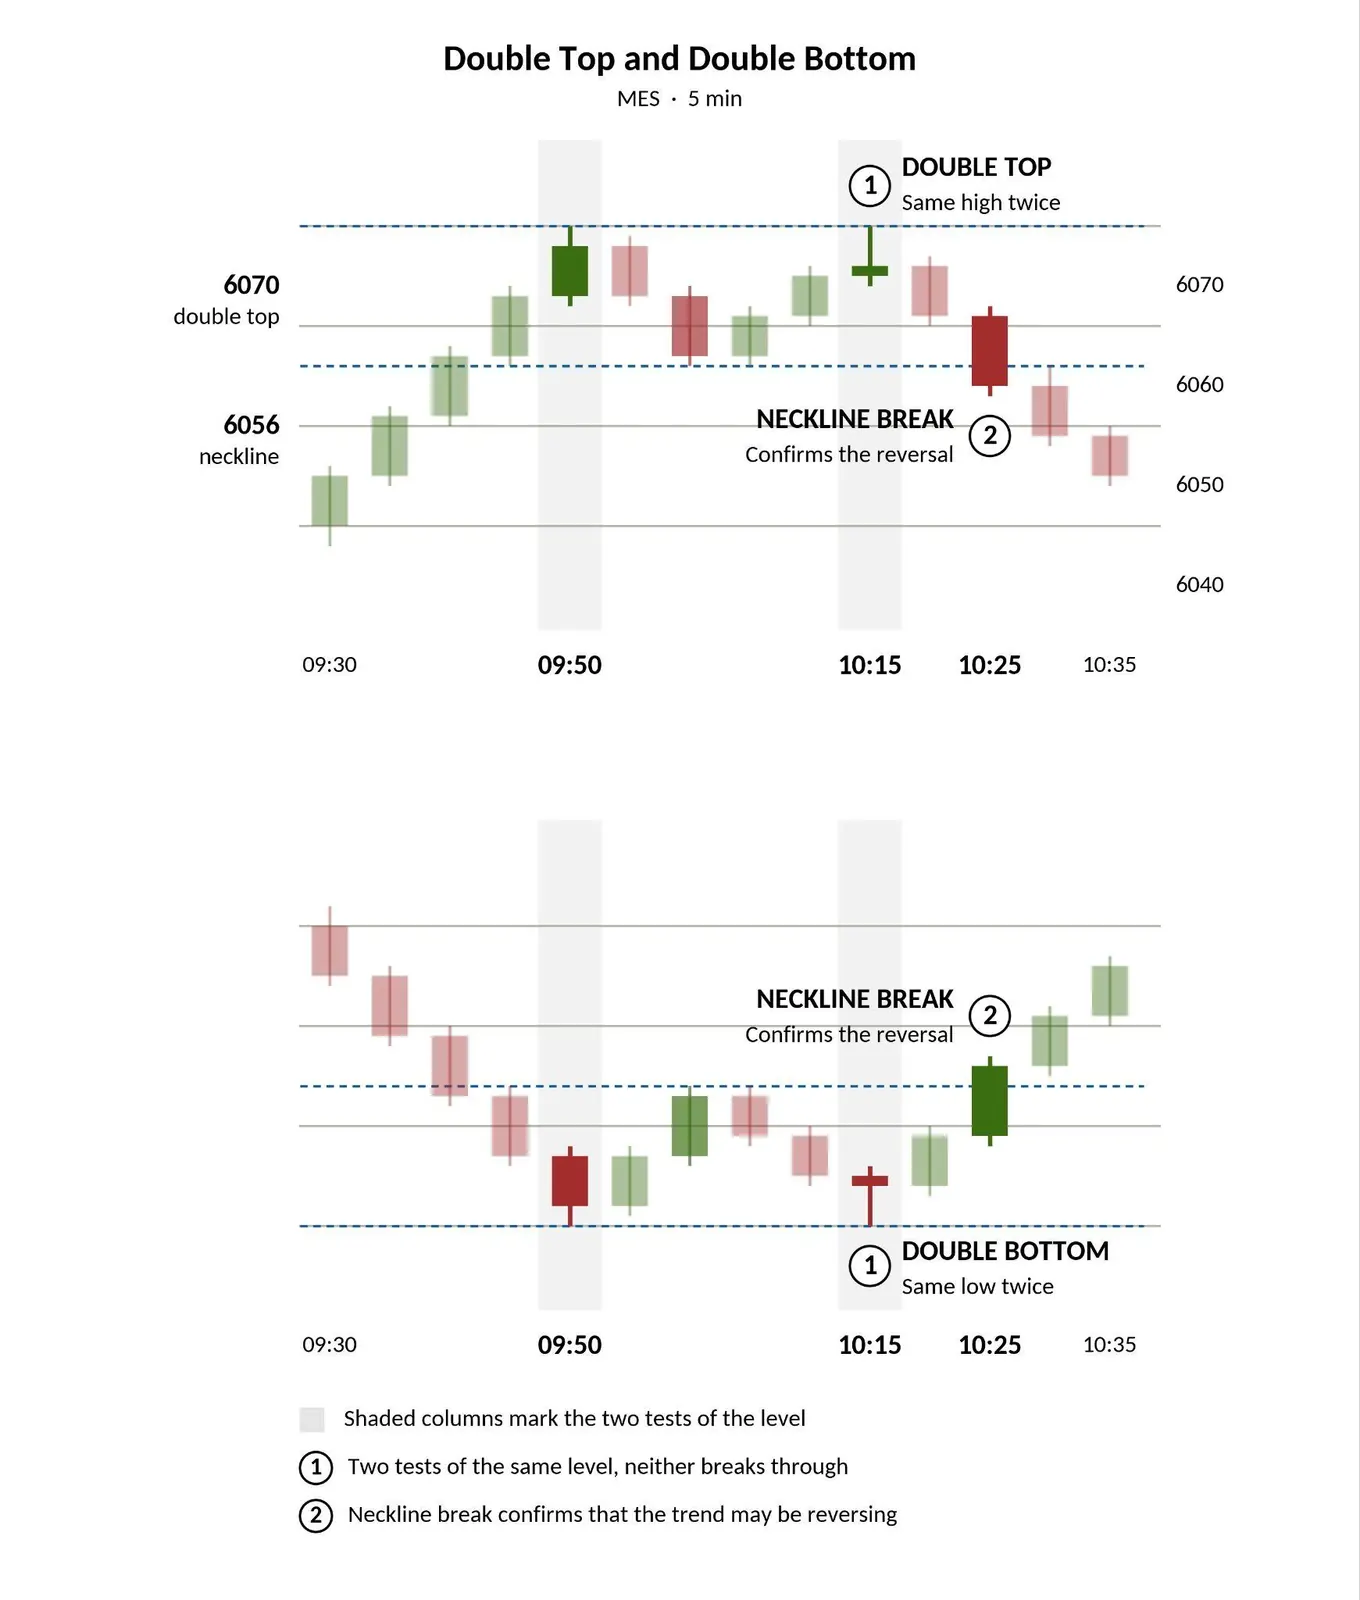
A double top is an "M"-shaped reversal pattern that forms when price tests a high twice and fails to break through, while a double bottom is the "W"-shaped mirror image at a low. Both are classic reversal patterns that suggest a trend may be running out of steam. For a wider look at these formations, read our breakdown of traditional technical patterns in futures.
A confirmed double top or bottom is often read as a sign that the prior trend could reverse.
5. Head and shoulders
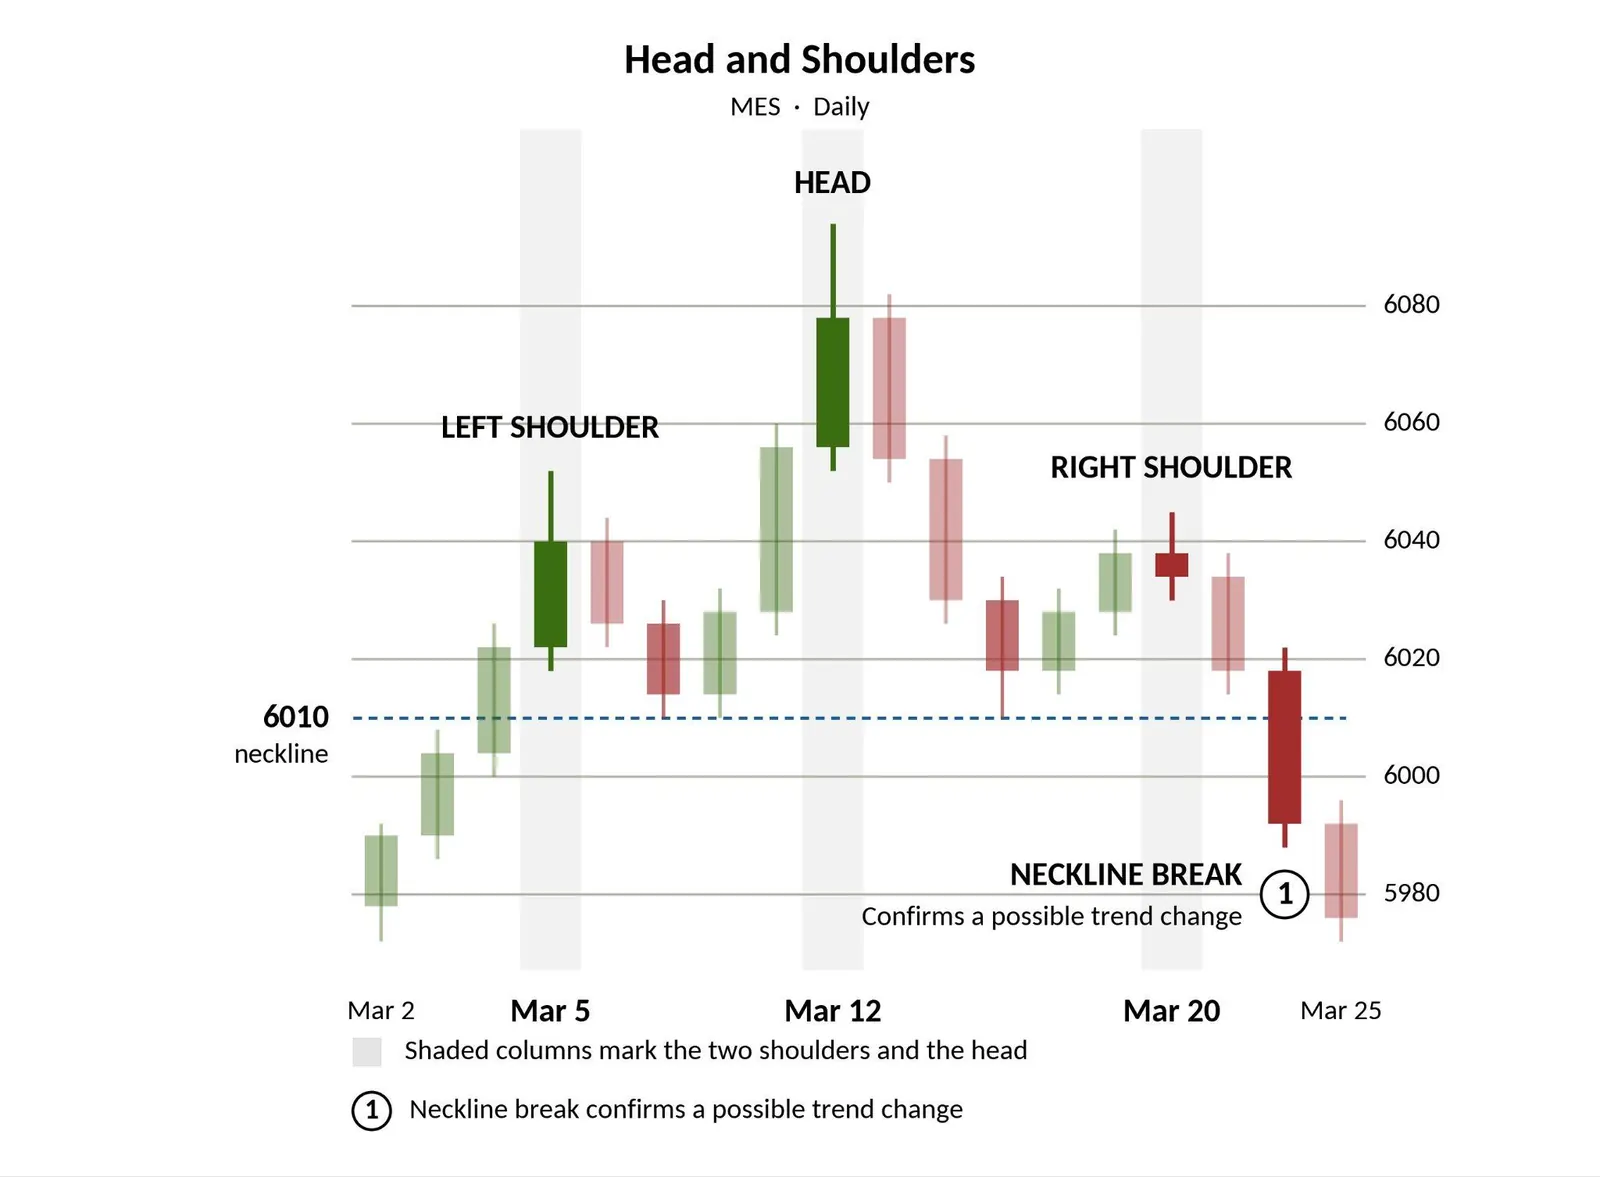
The head and shoulders pattern is a well-known reversal formation with three peaks: a higher middle peak (the head), flanked by two lower peaks (the shoulders). An inverted head and shoulders flips this at a market bottom. For the full breakdown, see our deep dive on the head and shoulders chart pattern.
A break below the pattern's neckline is the move many traders watch as confirmation of a possible trend change.
6. Cup and handle
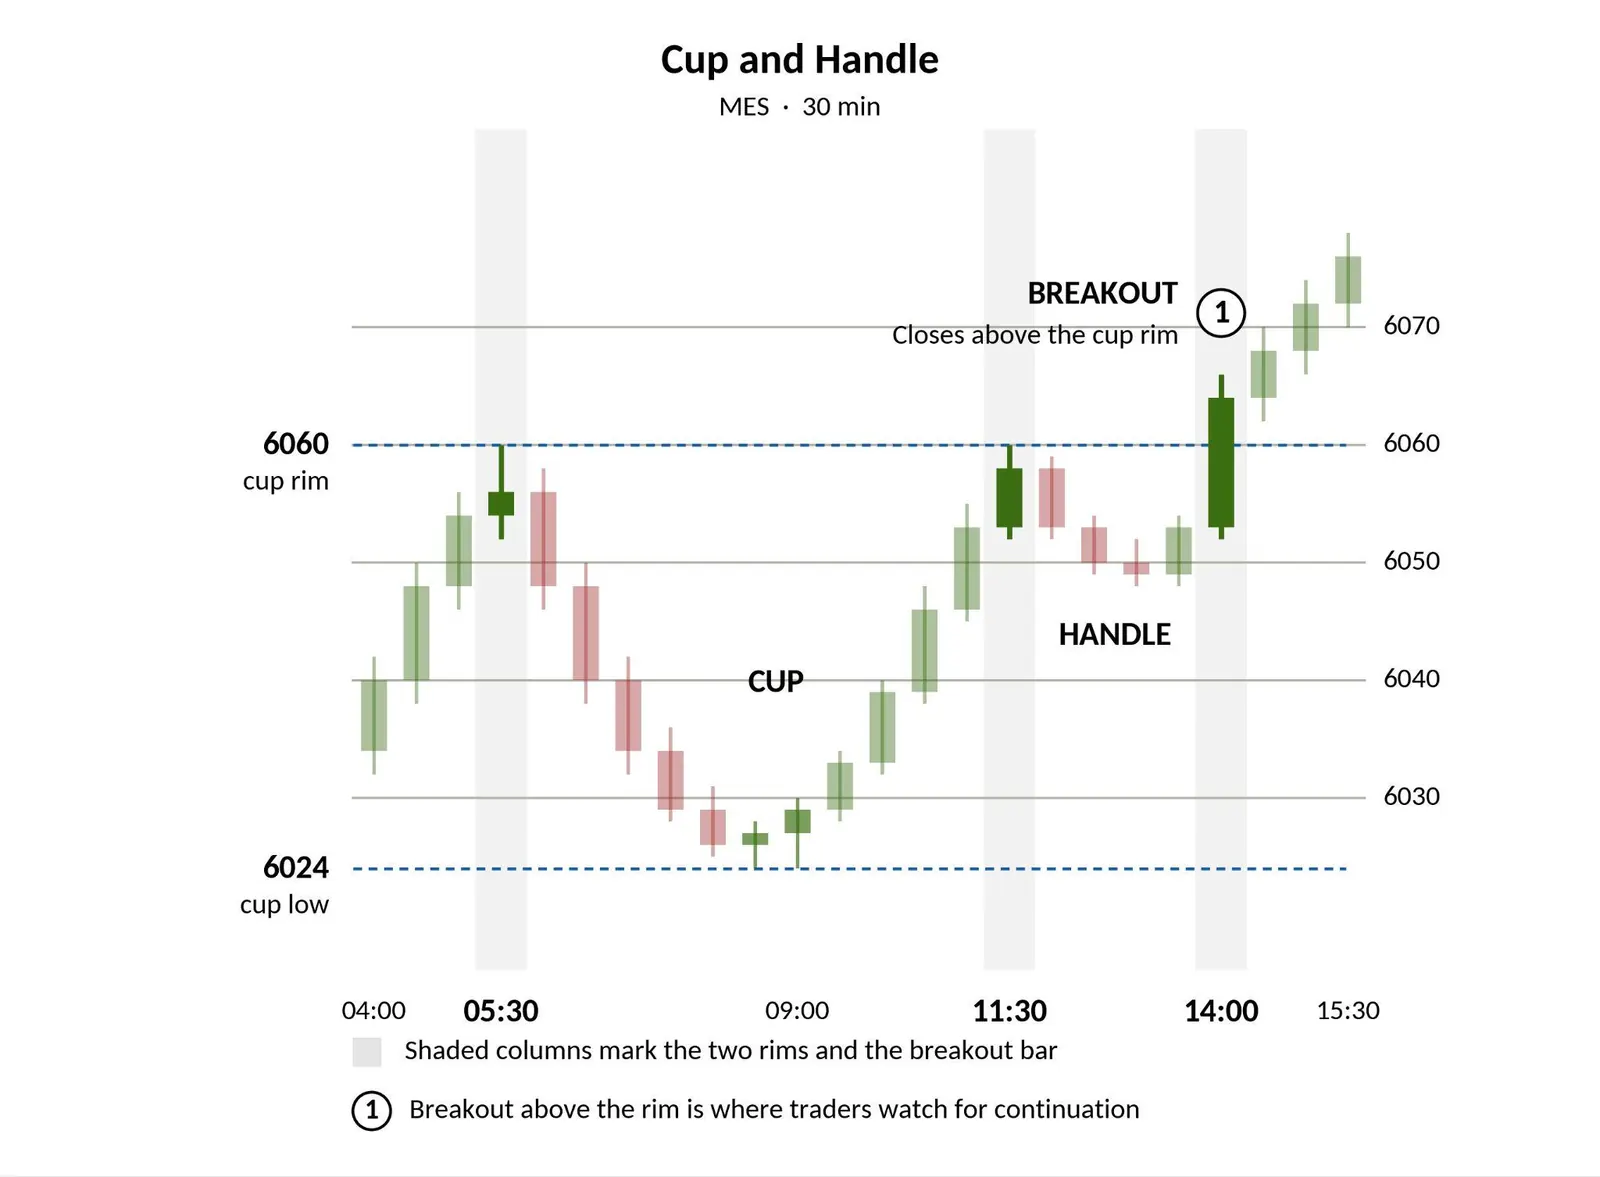
The cup and handle is a continuation pattern that looks like a rounded cup followed by a shorter pullback that forms the handle. It typically appears during an uptrend and can suggest the move may continue after the handle resolves. The pattern also has a bearish counterpart, which we cover in our guide to the inverted cup and handle pattern.
A breakout from the handle is the point many traders use to react to a potential continuation of the trend.
7. Flags and pennants
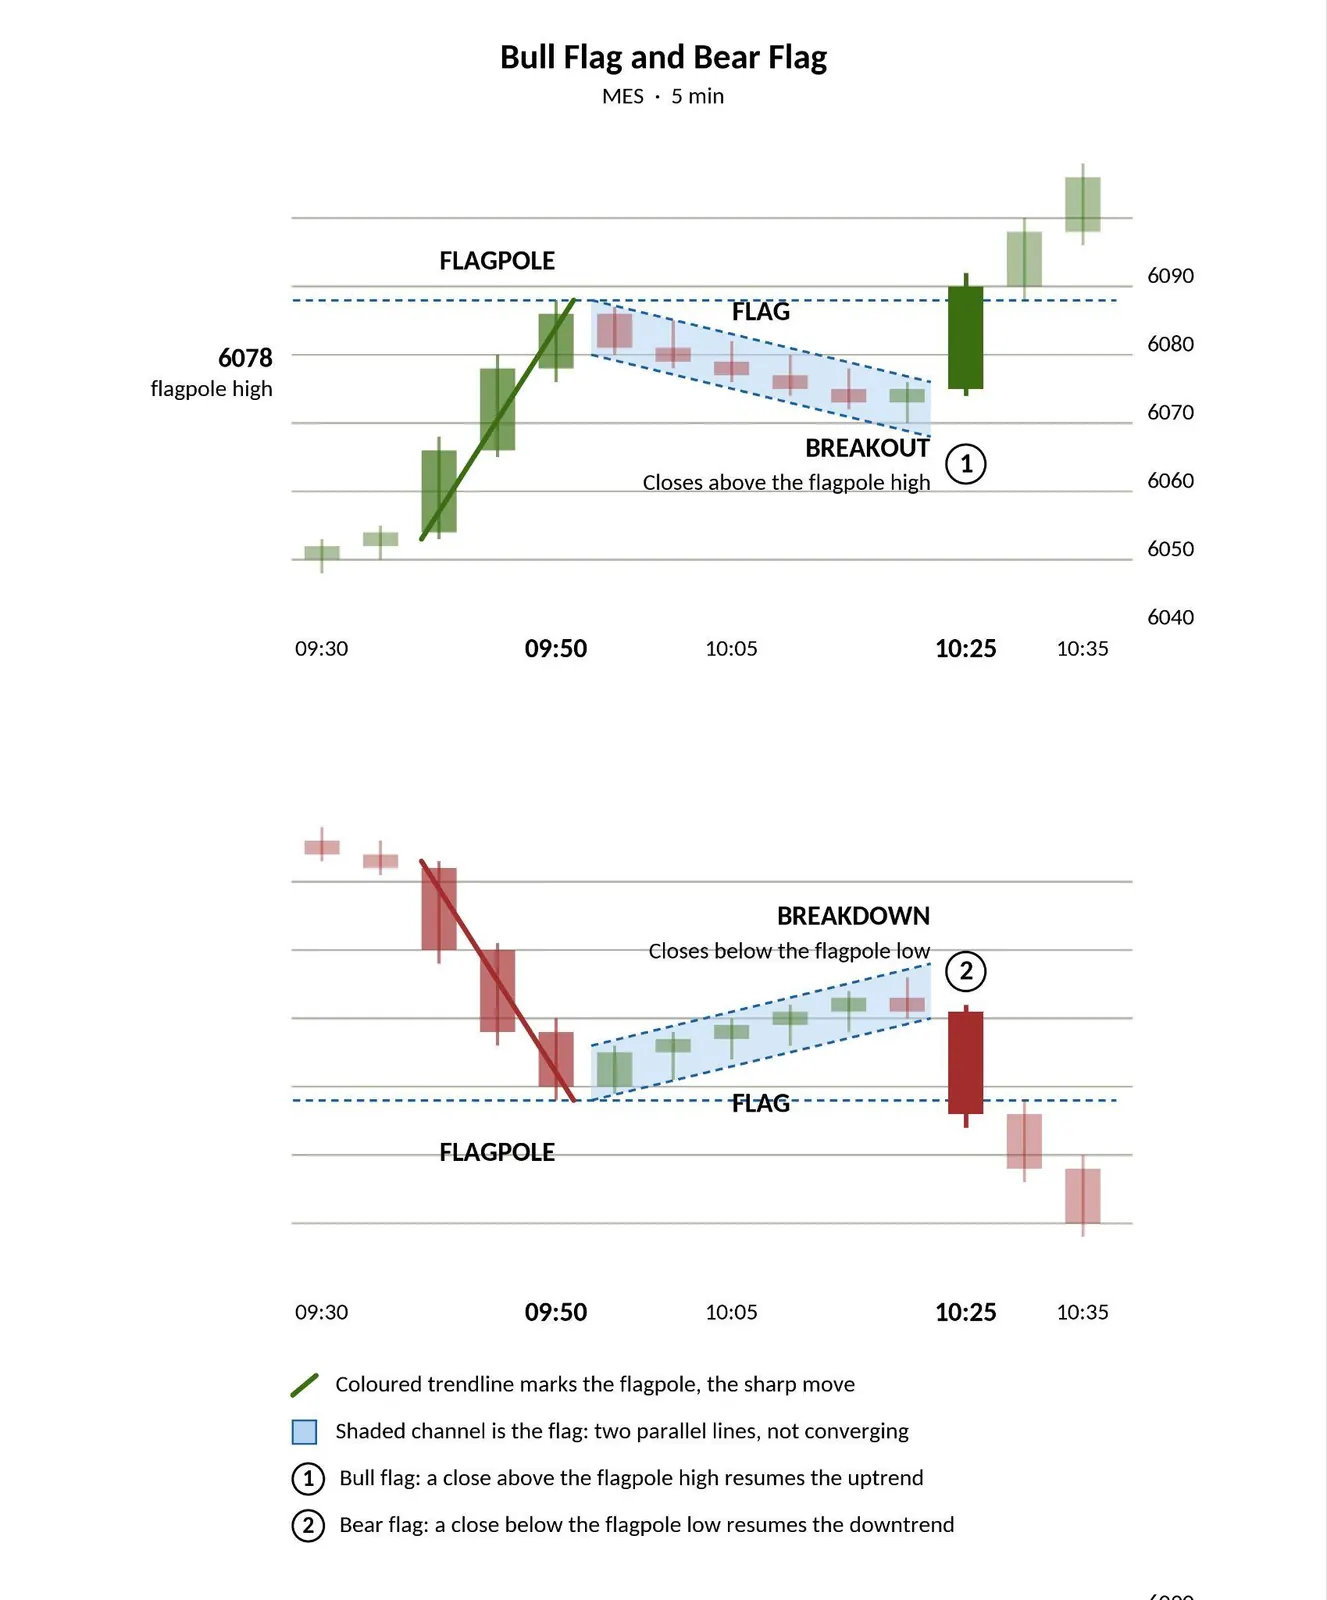
Flags and pennants are short-term continuation patterns that appear after a sharp price move. A flag looks like a small rectangular channel that slopes against the trend, while a pennant looks like a tiny symmetrical triangle. Both suggest the market is pausing before potentially resuming its move.
These patterns can mark a brief consolidation, and a breakout in the direction of the prior trend is a signal many traders react to.
8. Candlestick reversal patterns
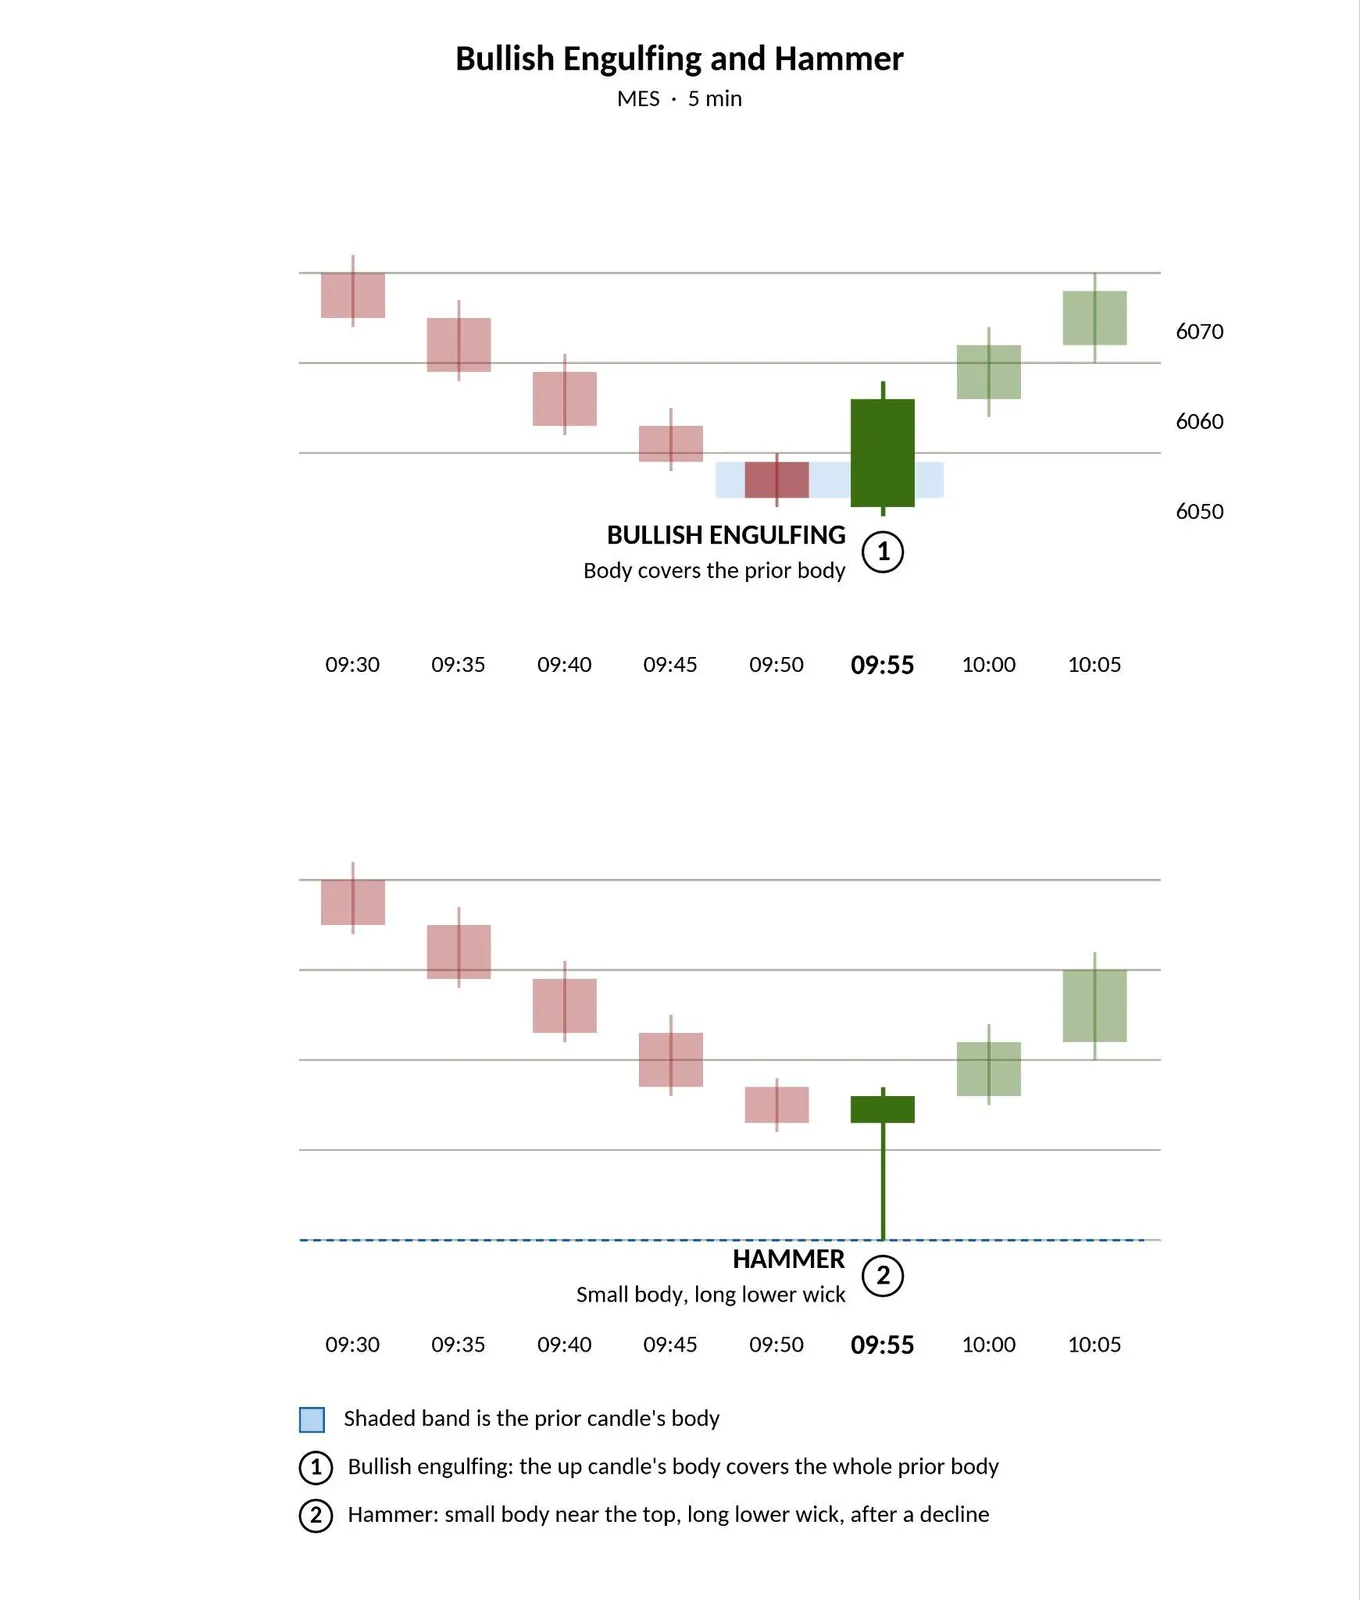
Candlestick patterns—most of which are reversing, like engulfing and hammer formations—are a specific type of chart pattern built from one or more individual candles. An engulfing pattern occurs when one candle's body fully covers the previous candle's body. A hammer is a single candle with a small body and long lower wick that can point to a bottom.
Because these signals show up on nearly every timeframe, they pair well with the broader patterns above. For more, read our guide to trading with candlestick patterns.
Candlestick reversals are often used alongside larger patterns to help confirm a potential turn rather than as standalone signals.
FAQs on chart patterns for futures trading
What are chart patterns in futures trading?
Chart patterns are recognizable price formations on a futures trading chart that traders use to anticipate potential trend reversals or continuations. They form from the natural rhythm of buying and selling and are a core tool in technical analysis.
What is the difference between reversal and continuation patterns?
Reversal patterns suggest the current trend may be changing direction, while continuation patterns suggest a trend is pausing before it resumes. Head and shoulders and double tops are common reversal patterns, while flags and pennants are common continuation patterns.
Are candlestick patterns the same as chart patterns?
Candlestick patterns—such as engulfing and hammer formations—are a specific type of chart pattern built from one or more individual candles. Broader chart patterns like head and shoulders usually form over many bars, while candlestick patterns can appear in just one or two.
Which chart patterns are most useful for beginners?
Many new traders start with clear, widely recognized patterns like double tops and bottoms, head and shoulders, and flags. These formations are easier to spot and can help build the pattern-reading habits that support more advanced analysis later.
Can I practice trading chart patterns without risking money?
Yes. New futures traders can practice recognizing and trading chart patterns risk-free using NinjaTrader's simulated trading environment before committing real capital. Practicing in a sim environment lets you test how patterns play out before committing real capital while you build familiarity with chart patterns and platform tools.