Head and shoulders patterns are widely recognized among traders as reliable indicators of trend exhaustion and potential reversals. By analyzing price action and volume during the formation of these patterns, traders can gain insights into shifting market sentiment and make more informed trading decisions.
Identifying Head and Shoulders Chart Patterns
Head and shoulders futures chart patterns are identified by a left shoulder, head, and right shoulder. The head and shoulders chart pattern can form in two types:
Top: A head and shoulders top pattern signals the end of an upward price trend.
Bottom: A head and shoulders bottom pattern signals the end of a downward price trend.
Traders use these formations to anticipate potential trend reversals and identify entry or exit points. Recognizing this pattern early can help futures traders take advantage of shifting market conditions.
Top Head and Shoulders Chart Patterns
A head and shoulders top pattern occurs after an extended uptrend and suggests a potential bearish reversal. This formation consists of three peaks:
Left shoulder: Marks the initial high in price after an uptrend, typically occurring on higher volume
Head: Forms as price moves to a new higher peak, often on lower volume
Right shoulder: Develops when price fails to reach the height of the head and starts declining, often on weaker volume than the left shoulder
Example: Crude Oil Futures (CL)
The crude oil futures (CL) chart below displays a head and shoulders top pattern:
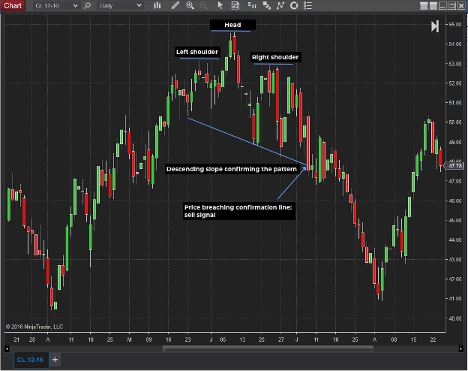
Left shoulder: Price action completes a strong uptrend and starts to pull back on declining volume
Head: A new high is established, but volume does not significantly increase, signaling potential weakness
Right shoulder: Price makes a lower high and declines, with lower volume than during the left shoulder formation
A critical confirmation of this pattern occurs when price breaks below the neckline—a support level connecting the lows between the left shoulder, head, and right shoulder. A break below the neckline on high volume signals a stronger bearish move.
Bottom Head and Shoulders Chart Patterns
A head and shoulders bottom pattern is a bullish reversal signal that occurs after an extended downtrend. It follows a similar structure but in reverse:
Left shoulder: A low forms after a downtrend, often on declining volume
Head: Price makes a new lower low, usually with increased volume
Right shoulder: A higher low forms, indicating the market may be gaining strength
Example: S&P 500 Futures (ES)
The S&P 500 futures (ES) chart below displays a head and shoulders bottom pattern:
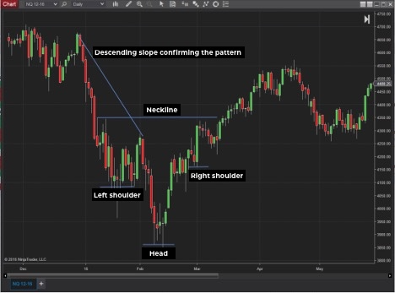
Left shoulder: The price trend is downward but stabilizes with lower volume
Head: A new low forms, often with higher volume, signaling potential accumulation
Right shoulder: A higher low is made, often on greater volume than during the left shoulder
The bullish confirmation occurs when price breaks above the neckline—a resistance level connecting the peaks between the left shoulder, head, and right shoulder. A breakout on strong volume suggests a stronger upside move.
Enhance Your Trading Strategy With Head and Shoulders Patterns
Futures traders can incorporate head and shoulders patterns into their trading strategy by:
Confirming the trend pattern: Use technical indicators like volume, moving averages, and relative strength index (RSI) to validate the reversal signal.
Setting entry points: Enter a trade when price breaks the neckline on strong volume.
Placing stop-loss orders: Place a stop-loss above the right shoulder (for short trades) or below the right shoulder (for long trades) to manage risk.
Identifying profit targets: The projected move after a breakout is often equal to the distance between the head and neckline.
By recognizing and confirming head and shoulders patterns, traders can enhance their ability to spot potential market reversals and refine their entry and exit strategies in the futures markets. Learn more about how to trade head and shoulders patterns on the award-winning NinjaTrader platform.

Trade Futures with NinjaTrader
Haven't signed up for your free NinjaTrader account yet? Get started today with a 14-day trial of live simulated futures trading.
