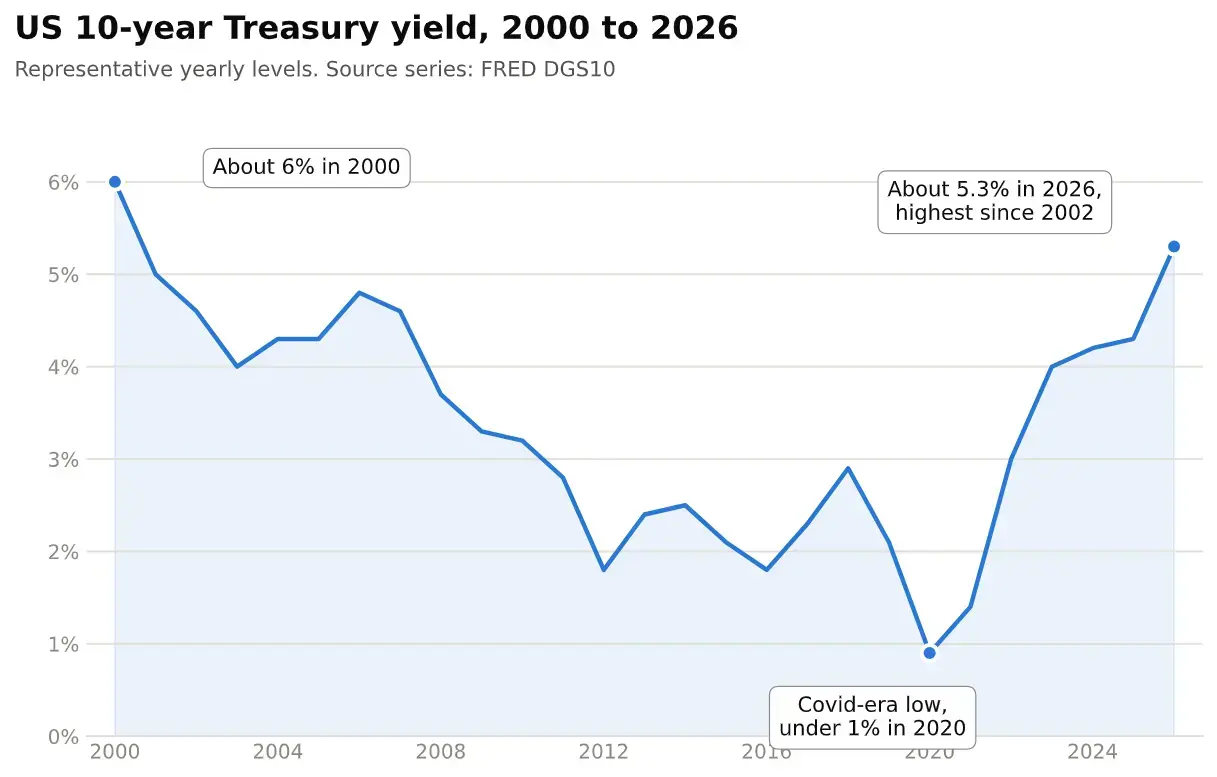
The 10-year Treasury yield climbed above 5.35% on October 7, the highest level since 2002. The 30-year sits near 5.70%.
If you've only traded in the last 15 years, you've never seen a bond market like this one, and it's reshaping the price of nearly everything.
Here's what's driving it, what it tends to mean for the markets you trade, and how to think about where it goes from here.
Why rising yields matter in the first place
The mechanics trip up a lot of newer traders. Bond prices and yields move in opposite directions. When traders sell bonds, prices fall, and yields rise.
What it meansSo, a rising yield isn't an abstract number. It means traders are demanding more compensation to hold government debt, whether because they expect higher inflation, a tighter Fed, or simply more supply than the market wants to absorb.
The 10-year Treasury yield is the anchor for the entire financial system. It helps set mortgage rates, car loans, corporate borrowing costs, and the rate the U.S. government pays on its own debt. When it moves from 4% to above 5%, the cost of borrowing rises for everyone at once. The average 30-year mortgage rate has already pushed to around 7.49%. That's the real economy feeling the bond market directly.
Why it is happening
There's no single cause here. Several forces hit the bond market at the same time, and most of them aren't the kind that reverse quickly.
Sticky inflation. Core inflation has stayed at or above 3% for months, well above the Fed's 2% target. An energy shock made it worse. Refinery problems tied to the Iran conflict and a halt in Russian diesel exports pushed fuel costs higher, and diesel feeds straight into freight, farming, and the cost of moving goods. When inflation runs hot, bond traders demand a higher yield to protect their purchasing power.
A rising term premium. This is the compensation traders want for the risk of holding long-dated debt. Think of it as the extra yield they require for locking money up for 10 or 30 years in an uncertain world. That premium has been climbing, and it's a big reason the long end of the curve has risen faster than the Fed alone would explain.
Heavy supply and a loss of confidence. The federal deficit is running near $1.9 trillion, and the government's net interest cost has reached roughly $1.05 trillion this fiscal year. An AI-driven corporate investment boom has added hundreds of billions in new bond issuance. More bonds for sale, from both Washington and corporate America, mean sellers have to offer higher yields to find buyers. When supply floods in and confidence in fiscal discipline thins out, yields rise.
A global move. This is not only a U.S. story. Government bond yields in Japan, the UK, and France have all hit multiyear and multidecade highs. When yields rise everywhere, they pull U.S. yields up with them.
One nuance worth watching. Inflation is high, but the job market is cooling, and credit spreads are starting to widen. That mix is pulling short-term yields down while long-term yields stay high, which steepens the yield curve. The gap between the 2-year and 10-year has widened to around 45 basis points. A steepening curve after a long flat stretch is a signal seasoned traders pay close attention to.
What this typically means for the markets
Interest-rate-sensitive assets come under pressure. Higher yields raise the bar for everything else. When a Treasury pays you 5% to take almost no risk, stocks, real estate, and growth assets all have to work harder to justify their price. That's why sharp yield spikes often rattle the equity market, and why high-growth and tech names, the kind that live in the Nasdaq, tend to feel it most.
The dollar strengthens. Higher U.S. yields attract foreign capital, because global traders chase the better return and have to buy dollars to do it. That has already shown up. The U.S. Dollar Index broke above 102 in early October, climbing to new highs for the year and out of the range it had held for a year and a half.
A strong dollar reaches everywhere. This is the part traders often underweight. A rising dollar makes U.S. exports more expensive abroad and imports cheaper at home. It pressures commodities. Oil, gold, and most raw materials are priced in dollars, so a stronger dollar tends to push their prices down. It squeezes emerging markets that borrowed in dollars and now have to repay with weaker local currencies. Large U.S. companies feel it too, because a stronger dollar eats into their overseas earnings.
One move in the bond market ripples through currencies, commodities, and corporate profits.
Some historical perspective
Step back, and the picture gets clearer. The last time the 10-year yield sat firmly above 5% was 2007, right before the financial crisis. Before that, you have to go back to the early 2000s. We're now at levels not seen in 24 years.
The era most traders think of as normal, the stretch from 2008 to 2021 when rates sat near zero, was the real anomaly. For most of modern history, a 5% 10-year yield wouldn't have raised an eyebrow.
What it meansWhat feels like a shock is in many ways a return to the long-run neighborhood rates used to live in.
The bond market is on track for one of its worst multi-year runs on record, and a generation of traders is learning in real time that yields can go up and stay up.
The Fed's role right now
The Federal Reserve sits at the center of this. In September, the Federal Open Market Committee (FOMC) raised its benchmark rate by a quarter point to a target of 3.75% to 4.00%, its first hike since 2023, on a unanimous vote. The committee's own projections point to the possibility of one more increase before year-end, and Fed Governor Christopher Waller said this week that more hikes may be needed to finally bring inflation to heel, though not necessarily right away.
There's an added layer this year. Kevin Warsh took over as Fed chair in May, replacing Jerome Powell, and the market is still reading how this committee will lean.
What it meansThe central question for every rate trader right now is simple. Does the Fed keep tightening to defend its inflation target, or does a cooling job market force it to ease even with inflation still above 3%?
That tension is exactly why rate expectations have been swinging, with the odds of an October hike moving from the mid-70% range down below 30% and back up inside a single stretch of days.
Possible ways to follow this in the futures markets
For educational purposes, here's how traders commonly watch a theme like this across the futures markets. None of this is a recommendation. It's a map of which markets move together.
The most direct expression is in Treasury futures. The contracts track different points on the curve: the 2-year, 5-year, 10-year, and the 30-year bond. Because price and yield move in opposite directions, rising yields show up as falling prices in these contracts. There are also micro-sized versions and yield-based contracts that let a trader follow the move at a fraction of the size while learning how the market behaves.
Beyond bonds, the ripple effects show up in the markets a new trader can watch. The U.S. Dollar Index and the currency futures reflect the dollar's strength. The equity index futures, especially the Nasdaq, react to yield spikes. Gold tends to trade off real yields and the dollar together.
Watching how these markets move in relation to one another, rather than trying to call the next tick, is where the real education is.
If you want to see it live, this is the kind of cross-market reaction the pros talk through every trading day on NinjaTrader Live.
For traders who want to follow the move directly, these are the CME interest rate futures that track U.S. Treasuries across the curve. The price-based contracts move opposite to yield, while the yield futures track the rate itself at $10 per basis point. The 10-year note, ZN, is the benchmark and the most active of them all.
| Product | Symbol | What it tracks |
|---|---|---|
| 2-Year T-note | ZT | Short end of the curve |
| 5-Year T-note | ZF | The belly of the curve |
| 10-Year T-note | ZN | The benchmark, the most actively traded of all |
| U.S. Treasury Bond | ZB | The long end, the classic bond |
| Ultra U.S. Treasury Bond | UB | Longest duration, the most movement per basis point |
| 10-Year Yield | 10Y | The 10-year yield itself, $10 per basis point |
| 30-Year Yield | 30Y | The 30-year yield itself, $10 per basis point |
The caution that matters most: These are fast, headline-driven markets, and leverage cuts both ways. Futures trading involves substantial risk and is not suitable for everyone. You can lose more than your initial investment. Study these relationships in a sim environment before you ever put real money behind a view.
Simulated trading is based on hypothetical results and does not reflect actual trading. Emotional and psychological factors of real money risk are not replicated. Use simulated trading to learn the platform and markets—not as an indicator of live performance.
Best case, worst case
The best case is an orderly one. Inflation cools through the back half of the year, the energy shock fades, the Fed signals it's near the end of its tightening and yields drift lower in a controlled way. Borrowing costs ease, the pressure on stocks lifts, and the bond market finds its footing without anything breaking.
The worst case is a disorderly one. Inflation stays stubborn, the deficit and heavy issuance keep flooding the market with supply, confidence in long-term U.S. debt erodes further, and yields spike past current levels faster than the economy can absorb. That path strains housing, corporate balance sheets, and the government's own interest bill, and it tends to arrive with the kind of volatility that punishes anyone who is overexposed.
The truth usually lands between the two, and it rarely travels in a straight line.
The traders who tend to handle an environment like this well usually didn't call the top or the bottom. They understood what was driving the move, respected the risk, and sized themselves to still be standing when the picture finally clears.