Coverage for the week of May 22nd – May 26th: In this week’s coverage, we examine pullbacks in the British Pound futures, consolidation in the E-Mini S&P 500 and Crude Oil futures, and the bearish trend in Copper futures. We also examine the economic report releases and companies reporting earnings in the coming days.
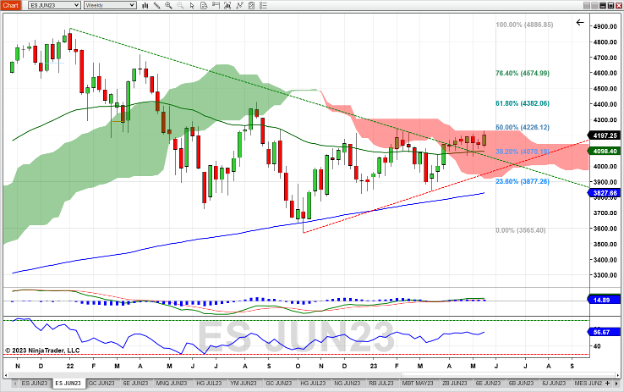
June E-Mini S&P 500 Future Weekly Chart
The June E-Mini S&P 500 future showed a bit of spark last week, finishing around the 4200 level (a psychological level that happened to coincide with options expiration). It couldn’t quite find the momentum to close or even trade above the Ichimoku cloud at 4225, which could be a major resistance level in an uptrend. This also corresponds to a 50% Fibonacci retracement level, determined by the high in October 2021 to the low in October 2022. The MACD continues to trend positive, and the RSI at 56+ and trending up is bullish as well. Should the market pull back, support might be found at the 50-day moving average (~4098) and the 38% Fib retracement level (4070).

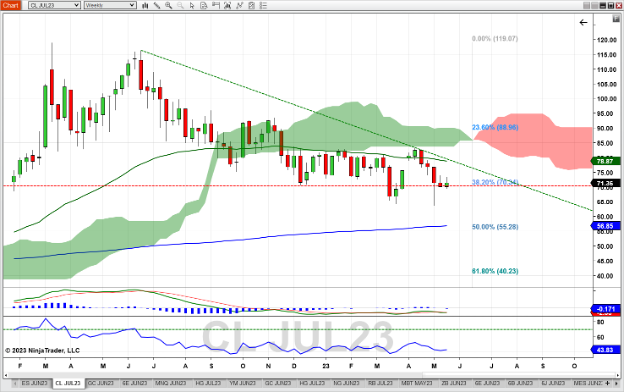
July Crude Oil Future Weekly Chart
The July Crude Oil future found support at the 38% Fibonacci retracement level (70.34) as determined by the low in April 2020 to the high in March 2022. The MACD study shows a cross below the signal line while beneath the zero line – both are bearish indications. The RSI is toward the lower end of the neutral range (~43.83) but is turning up, showing possible signs of a trend reversal. While price is below the Ichimoku cloud (bearish), it is also between the 52-week and 200-week moving averages. Should current support fail, support might be found at the 200-week moving average which coincides with the 50% Fib retracement level (~55.28). Resistance could occur at the confluence of the 52-week moving average and the downward-sloping trendline as drawn by the highs in June 2022 and April 2023 (~78.90).

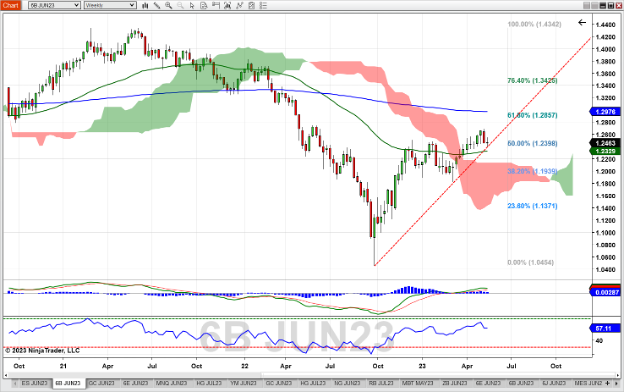
June British Pound Future Weekly Chart
The pullback in the weekly June British Pound Future chart paused as last week’s close saw little advance from the open. The low of last week tested and found support at the rising trendline, connecting lows from September 2022 to March 2023. This pause also occurs at the 50% Fibonacci retracement level from the high mid-July 2021 to September 2022’s low. The MACD is positive, though shows signs of weakening as the histogram is trending toward a cross below the zero line (which could indicate a stall or reversal to the downside in price). RSI is in line with price, though a failure to get to overbought at the recent high earlier this month shows weakness. Support could be found at the 52-week moving average (~1.2330) and the top of the Ichimoku cloud (~1.2125). A reverse to the upside could see resistance at the 61% Fib retracement level (1.2857).

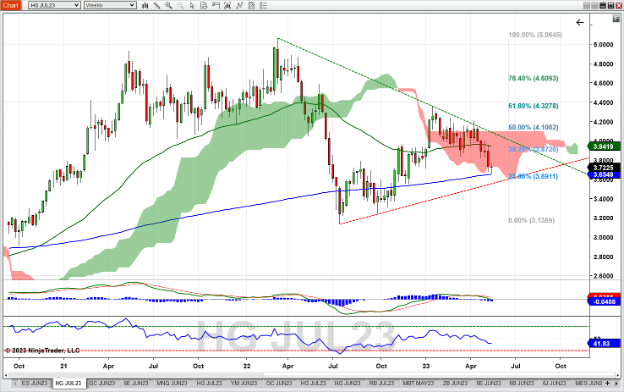
July Copper Future Weekly Chart
The July Copper future continued its downtrend, finding support at the 200-week moving average. It closed below the Ichimoku cloud for the first time since January – a bearish indication. The MACD crossed below zero while the histogram continues to decrease – both are bearish MACD situations. RSI continues to trend downward, though it still has some room to go to get oversold at 30. If the current trend continues, support might be found at the 200-week moving average (~3.6550) and the trendline formed by connecting lows in July and September 2023 (~3.5600). Should the price reverse to the upside, look for the 52-week moving average (~3.9400) to act as resistance.

Companies Reporting Earnings May 22nd – May 26th
Commentary: Retail and Canadian Banks share the spotlight this week. BJ’s and Lowes report Tuesday morning, Kohl’s on Wednesday morning and Best Buy, Dollar Tree, CostCo and the Gap on Thursday. Canadian Banks include Bank of Montreal, Canadian Imperial Bank, RBC and TD Bank – which could tell us about the Canadian economy, important especially to CAD FX traders. Tech companies Agilent and NVIDIA report Tuesday and Wednesday.
| Date | Earnings Reports |
|---|---|
| Monday, May 22nd | Zoom Video Communications (ZM): $0.99 EPS Estimate, $1.08B Revenue Estimate (AMC) |
| Tuesday, May 23rd | BJ’s Wholesale Club, Inc. (BJ): $0.84 EPS Estimate, $4.81B Revenue Estimate (BMO) Lowe’s Companies, Inc. (LOW): $3.49 EPS Estimate, $21.66B Revenue Estimate (BMO)* Agilent Technologies (A): 1.27 EPS Estimate, $1.67B Revenue Estimate (AMC)* |
| Wednesday, May 24th | Bank of Montreal (BMO): $2.35 EPS Estimate, $6.06B Revenue Estimate (BMO) Bank of Nova Scotia (BNS): $1.33 EPS Estimate, $6.00B Revenue Estimate (BMO) Kohl’s Corporation (KSS): ($0.44) EPS Estimate, $3.34B Revenue Estimate (BMO) NVIDIA Corp. (NVDA): $0.91 EPS Estimate, $6.52B Revenue Estimate (AMC)* |
| Thursday, May 25th | Best Buy Co., Inc. (BBY): $2.32 EPS Estimate, $9.54B Revenue Estimate (BMO)* Canadian Imperial Bank (CM): $1.32 EPS Estimate, $4.24B Revenue Estimate (BMO) Dollar Tree Stores, Inc. (DLTR): $1.51 EPS Estimate, $7.28B Revenue Estimate (BMO)* Royal Bank of Canada (RY): $2.09 EPS Estimate, $9.76B Revenue Estimate (BMO) TD Bank Group (DLTR): $1.53 EPS Estimate, $9.35B Revenue Estimate (BMO) Costco Wholesale Corporation (COST): $3.32 EPS Estimate, $54.62B Revenue Estimate (AMC)* Gap, Inc. (GPS): ($0.17) EPS Estimate, $3.30B Revenue Estimate (AMC)* |
| Friday, May 26th | Big Lots Inc. (BIG): ($1.87) EPS Estimate, $1.19B Revenue Estimate (BMO) |
* indicates that this company is in the S&P 500 Index
Economic Reports for the week of May 1st – May 5th
Commentary: This week begins with four different Federal Reserve Bank Presidents speaking on Monday and Tuesday – James Bullard (St. Louis), Thomas Barkin (Richmond), Mary Daly (San Francisco) and Lorrie Logan (Dallas).
With little other economic news on Monday, these Fed speakers could introduce volatility to stock index, currency, and gold futures. GDP arrives on Thursday morning, along with jobless claims – which could give direct insight into whether a soft landing is in the cards for the U.S. economy. Personal Income and Outlays could be a market mover before market open on Friday.
Other reports shedding light on recession possibilities are PMI Composite Flash and Richmond Fed manufacturing on Tuesday, and Chicago Fed national Activity on Thursday. The FOMC Minutes from the last Fed meeting arrive on Wednesday afternoon, which could be a market mover as well. Be aware that the Fed speakers listed might not encompass all appearances occurring next week. Also, news on the debt ceiling issue could affect price behavior at any time.
| Date | Economic Reports |
|---|---|
| Monday, May 22nd | 8:30 AM ET: St. Louis Federal Reserve Bank President James Bullard Speech 10:50 AM ET: Richmond Federal Reserve Bank President Thomas Barkin Speech 11:00 AM ET: Export Inspections 11:05 AM ET: San Francisco Federal Reserve Bank President Mary Daly Speech 4:00 PM ET: Crop Progress |
| Tuesday, May 23rd | 9:00 AM ET: Dallas Federal Reserve Bank President Lorrie Logan Speech 9:45 AM ET: PMI Composite Flash* 10:00 AM ET: New Home Sales 10:00 AM ET: Richmond Fed Manufacturing Index* 1:00 PM ET: Money Supply 4:30 PM ET: API Weekly Oil Stocks |
| Wednesday, May 24th | 7:00 AM ET: MBA Mortgage Applications 8:00 AM ET: Bank Reserve Settlement 10:30 AM ET: EIA Petroleum Status Report* 11:00 AM ET: Survey of Business Uncertainty 2:00 PM ET: FOMC Minutes 3:00 PM ET: Cold Storage |
| Thursday, May 25th | 8:30 AM ET: Export Sales 8:30 AM ET: Jobless Claims*** 8:30 AM ET: Corporate Profits 8:30 AM ET: GDP*** 8:30 AM ET: Chicago Fed National Activity Index 10:00 AM ET: Pending Home Sales Index 10:30 AM ET: EIA Natural Gas Report* 10:30 AM ET: Boston Federal Reserve Bank President Susan Collins Speech 11:00 AM ET: Kansas City Fed Manufacturing Index 4:30 PM ET: Fed Balance Sheet |
| Friday, May 26th | 8:30 AM ET: Durable Goods Orders* 8:30 AM ET: Personal Income and Outlays* 8:30 AM ET: International Trade in Goods (Advance) 8:30 AM ET: Wholesale Inventories (Advance) 8:30 AM ET: Retail Inventories (Advance) 10:00 AM ET: Consumer Sentiment 1:00 PM ET: Baker Hughes Rig Count |
*** Market Moving Indicators
* Merit Extra Attention
Get Started with NinjaTrader
NinjaTrader supports more than 800,000 traders worldwide with a powerful and user-friendly trading platform, discount futures brokerage and world-class support. NinjaTrader is always free to use for advanced charting and strategy backtesting through an immersive trading simulator.
Download NinjaTrader’s award-winning trading platform and get started with a free trading demo with real-time market data today!

