A trendline is a straight line drawn through two or more swing lows (an uptrend line) or swing highs (a downtrend line) on a chart, and traders often use it to mark the direction of a trend and potential diagonal support or resistance. In NinjaTrader's desktop platform, traders can draw a trendline by opening the Drawing Tools menu, selecting the Line tool (default hot key F2), and clicking and dragging on the chart to place it.
This guide covers the Line, Ray, and Extended Line tools, how to edit and save a trendline, and the TrendLines indicator that plots lines automatically. The examples use E-mini S&P 500 (ES) and E-mini Nasdaq-100 (NQ) charts.
Any trading symbols, company names, logos, or trademarks displayed are used for illustrative purposes only and remain the property of their respective owners. Their use does not imply affiliation with, endorsement by, or sponsorship of NinjaTrader, nor do any trading symbols displayed constitute investment advice or recommendations.
What is a trendline on a chart?
A trendline connects swing points on a chart. A swing high is a peak where price turns down after rising, with lower highs on either side; a swing low is a trough where price turns up after falling, with higher lows on either side. An uptrend line runs through swing lows and slopes upward, while a downtrend line runs through swing highs and slopes downward. Because it slopes, a trendline can mark diagonal support or resistance, where a horizontal level marks a single price.
A swing high is a peak where price turns down after rising, with lower highs on either side; a swing low is a trough where price turns up after falling, with higher lows on either side.
Each end of a drawn line sits on an anchor point, a spot on the chart that holds one end of the drawing and can be moved. The line itself is a drawing object, the term NinjaTrader's desktop platform uses for anything placed on a chart with the drawing tools. For the concept behind trends, see how traders identify trends in futures markets. Horizontal support and resistance levels have their own guide, and some chart patterns, such as triangles, are drawn with trendlines too, as the guide to chart patterns shows.
How do you draw a trendline in NinjaTrader?
Follow these four steps to draw a trendline with the Line tool in NinjaTrader:
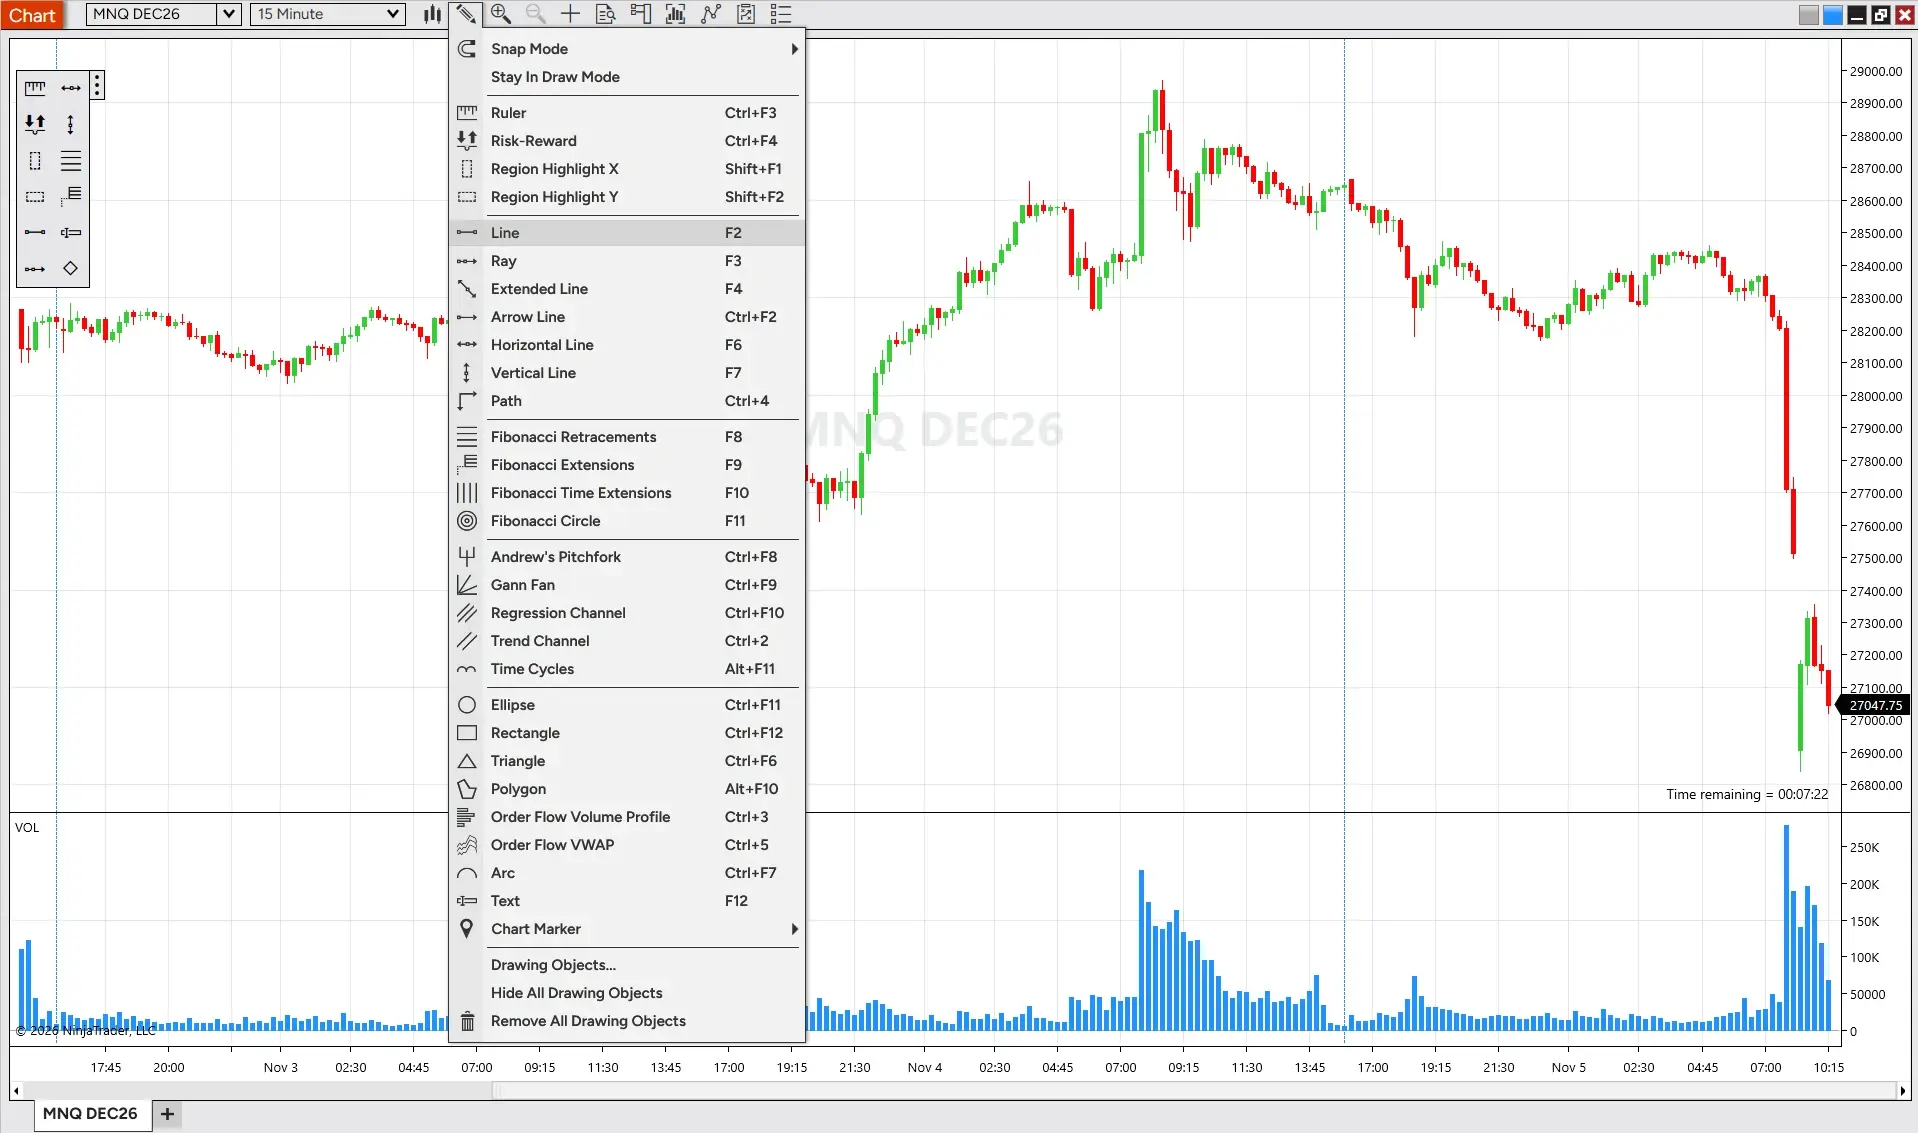
- Open the Drawing Tools menu by right-clicking the chart and choosing Drawing Tools, or by clicking the pencil icon at the top of the chart.
- Select Line; the default hot key is F2.
- Click and drag within the chart to place the line.
- Drag either anchor point to reposition the line. Right-clicking or pressing Esc cancels the tool before a line is placed.
The Drawing Tools menu lists each tool beside its default hot key, so a tool can also be selected by pressing its key. The support center's Drawing Tools article covers the drawing tools and their properties.
The Drawing Tools menu lists each tool beside its default hot key, so a tool can also be selected by pressing its key.
Two anchor points define the line, and moving either one changes its slope.
Where those anchor points sit decides whether the line is an uptrend line or a downtrend line.
How do you draw an uptrend line and a downtrend line?
The Line tool draws both uptrend and downtrend lines: an uptrend line has its anchor points on two swing lows, and a downtrend line has them on two swing highs. The prices in both examples below are illustrative, not market data.
The Line tool draws both uptrend and downtrend lines: an uptrend line has its anchor points on two swing lows, and a downtrend line has them on two swing highs.
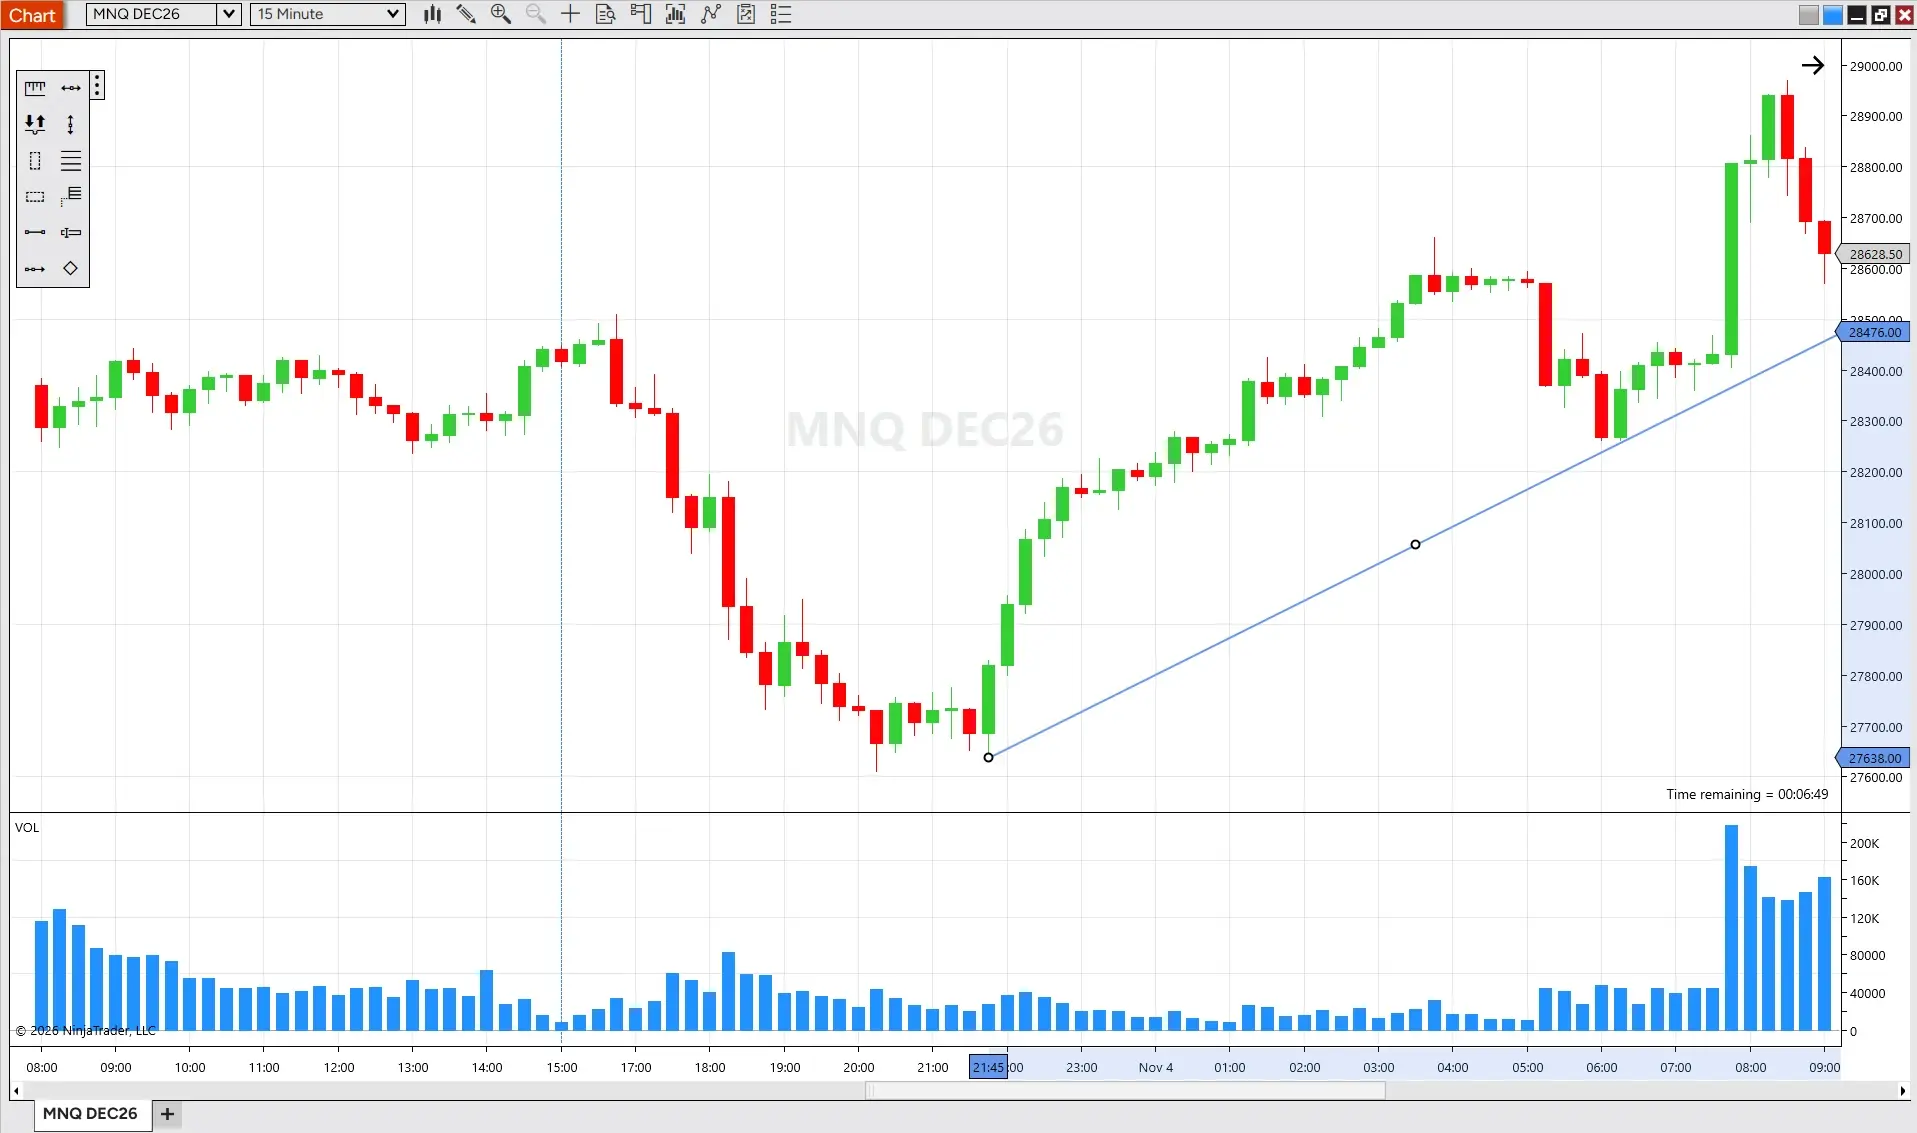
An uptrend line on an NQ chart
Take a 15-minute NQ chart with two swing lows, the first at 27,638 and the second at 28,265.00, 34 bars later. With the first anchor point on the first low and the second on the second low, the line rises an average of 18.16 points per bar.
A downtrend line on an ES chart
Now take a 15-minute ES chart with three swing highs, the first at 7,695.00, the second at 7,635.00, and the third at 7,618.25. With an anchor point on each high, the line falls a half point or 0.5 points per bar.
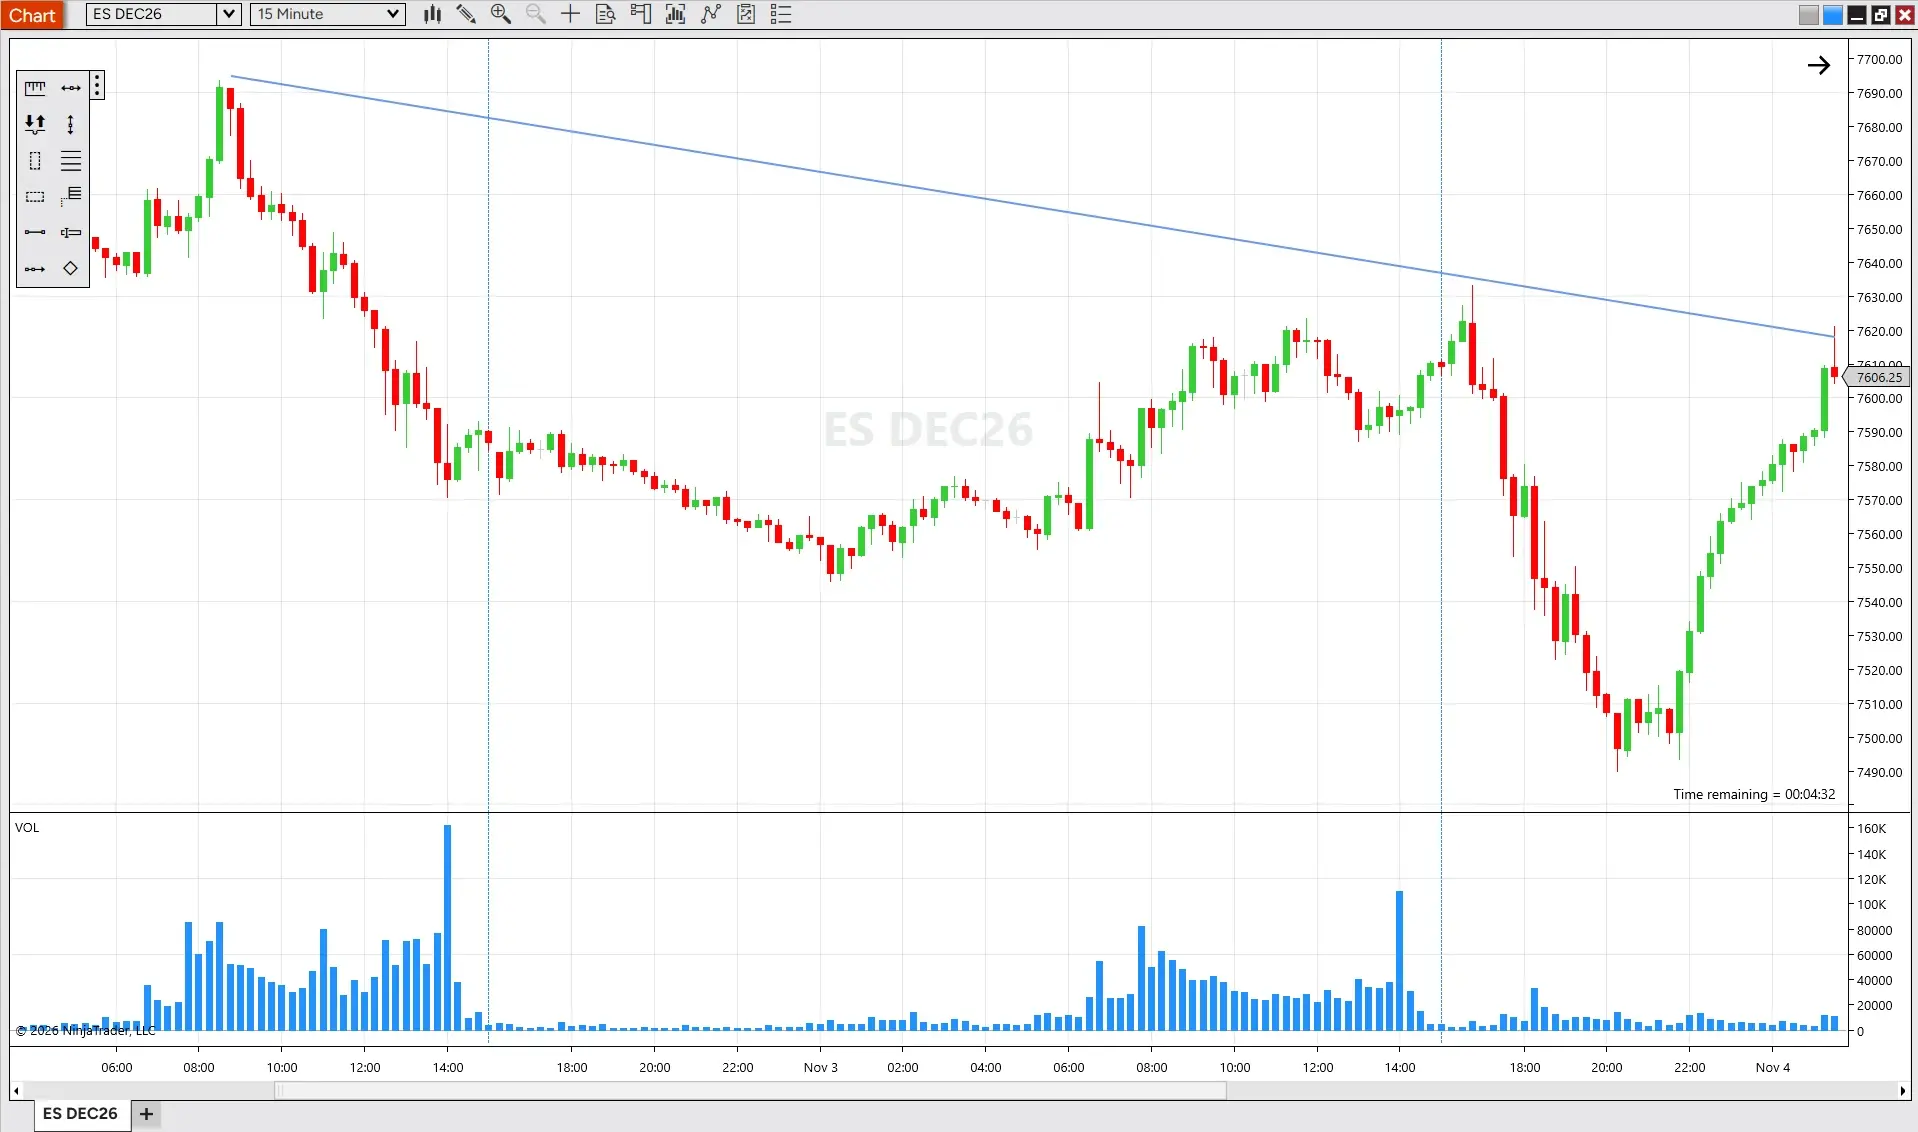
The tool is the same for both directions, and the anchor points set whether the line slopes up or down.
The Line is only one of three tools for drawing these lines.
What is the difference between a line, a ray, and an extended line?
NinjaTrader's desktop platform offers three line tools for drawing trendlines: the Line, which runs between two anchor points; the Ray, which extends in one direction; and the Extended Line, which extends in both directions (default hot keys F2, F3, and F4). The table sets them side by side.
NinjaTrader's desktop platform offers three line tools for drawing trendlines: the Line, which runs between two anchor points; the Ray, which extends in one direction; and the Extended Line, which extends in both directions (default hot keys F2, F3, and F4).
| Tool | Default hot key | What it does |
|---|---|---|
| Line | F2 | Runs between its two anchor points and stops at each one. |
| Ray | F3 | Extends in one direction past its anchor points. |
| Extended Line | F4 | Extends in both directions past its anchor points. |
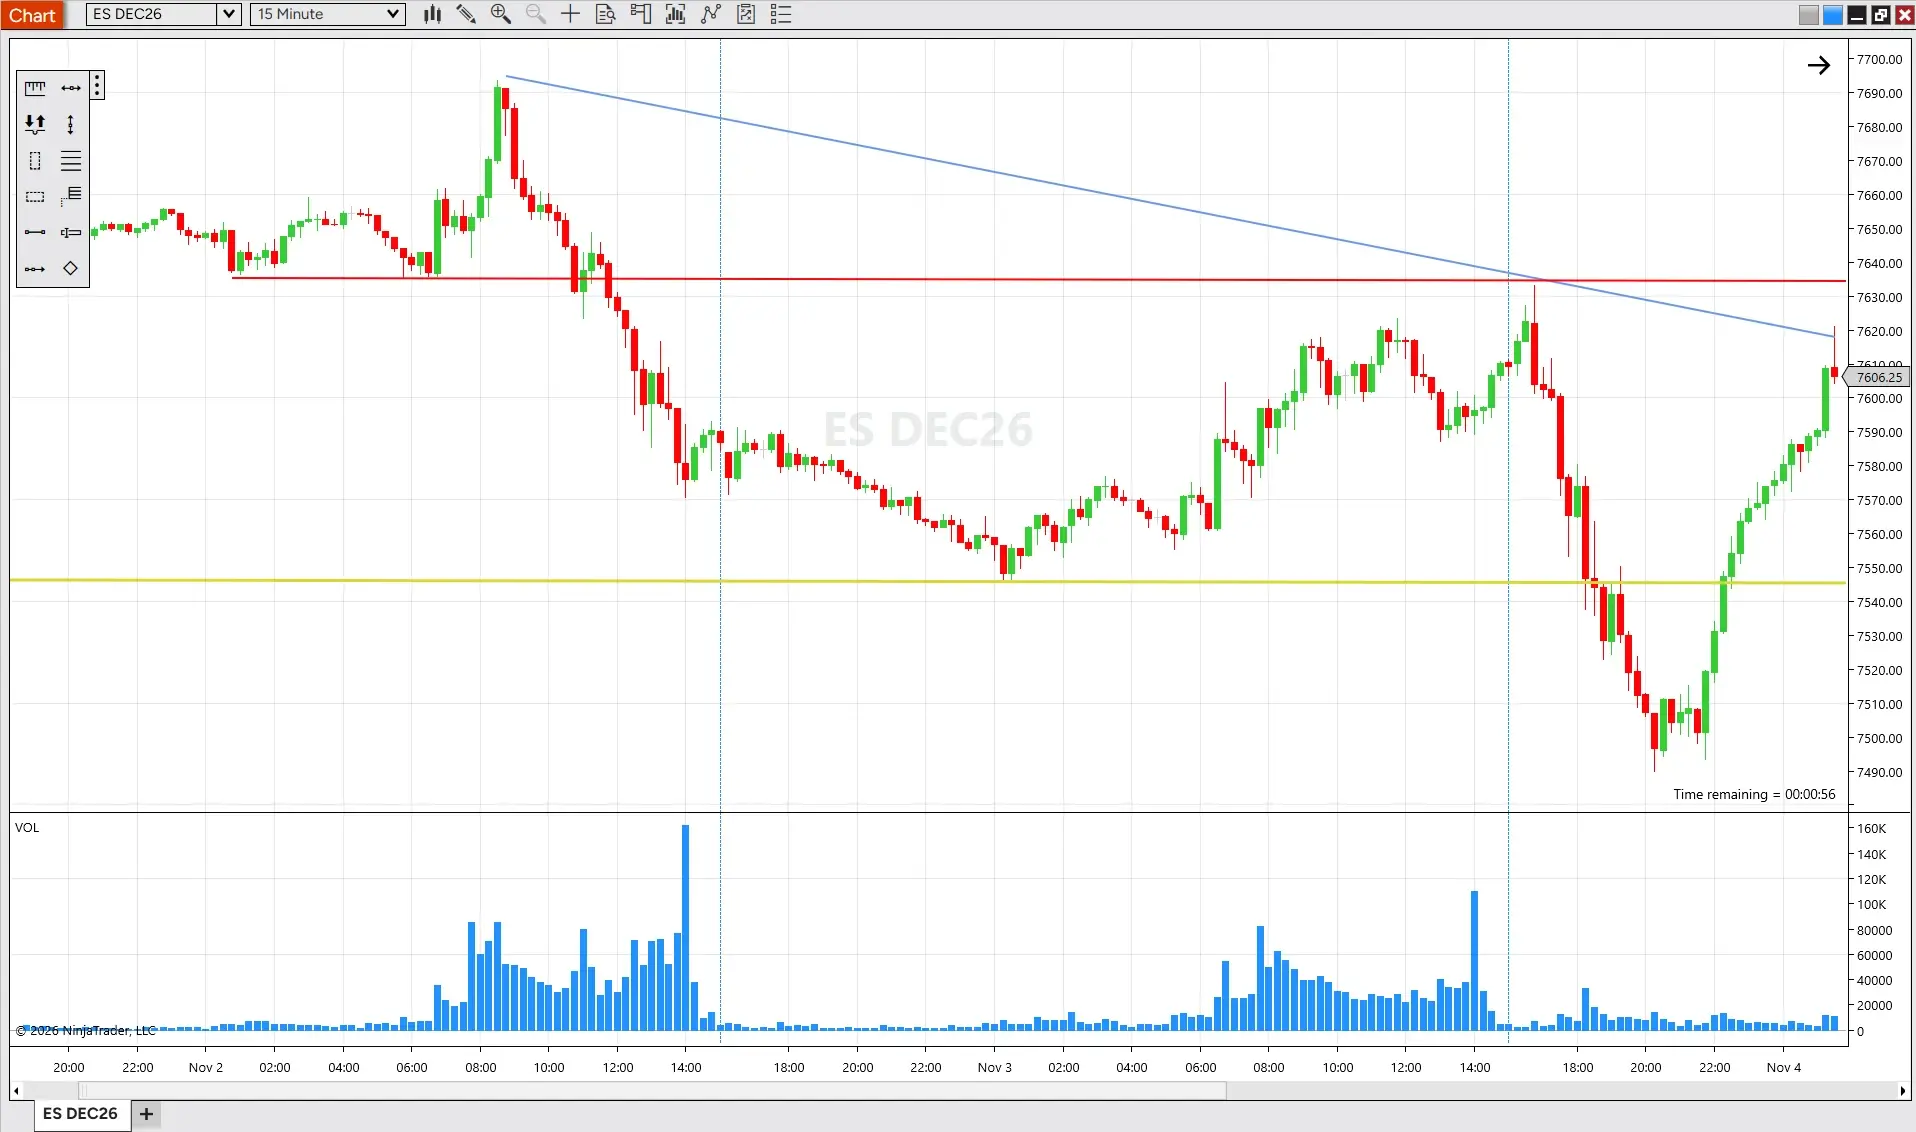
A Line stays between its anchor points, while a Ray and an Extended Line continue past them.
To draw two parallel lines as a channel, the Trend Channel tool (default hot key Ctrl + 2) is built for it, and the guide to trend channels covers how it works. Once a line is placed, a few settings control how it looks and behaves.
How do you adjust, style, and save a trendline?
A placed trendline has several settings, and most are a click or two away:
- Move an anchor point: Select the line to show its anchor points, then drag either one.
- Step the angle: After placing the first anchor point, holding Shift while you move the mouse steps the line in 45-degree increments.
- Open properties: Double-click the line, or right-click it and choose Properties, to open the Drawing Object Properties window, where color, dash style, and width are set.
- Lock it: The Locked property fixes the line in place so it can't be dragged, and it's also in the right-click menu.
- Stay in Draw Mode: Turned on from the Drawing Tools menu, it keeps the selected tool active after each line, so several lines can be placed in a row.
- Snap mode: Also in the Drawing Tools menu, it has five options: Disabled, Bar, Tick, Bar and Tick, and Bar and Object.
- Attach to: In the line's properties, this setting applies the line to a single chart or to every chart of the same instrument.
- Templates: A line's settings can be saved as a template from the Drawing Object Properties window, and Save as default makes them the default for that tool.
- Remove it: Select the line and press Delete, or right-click it and choose Remove.
The full drawing tools reference covers the properties every drawing object shares.
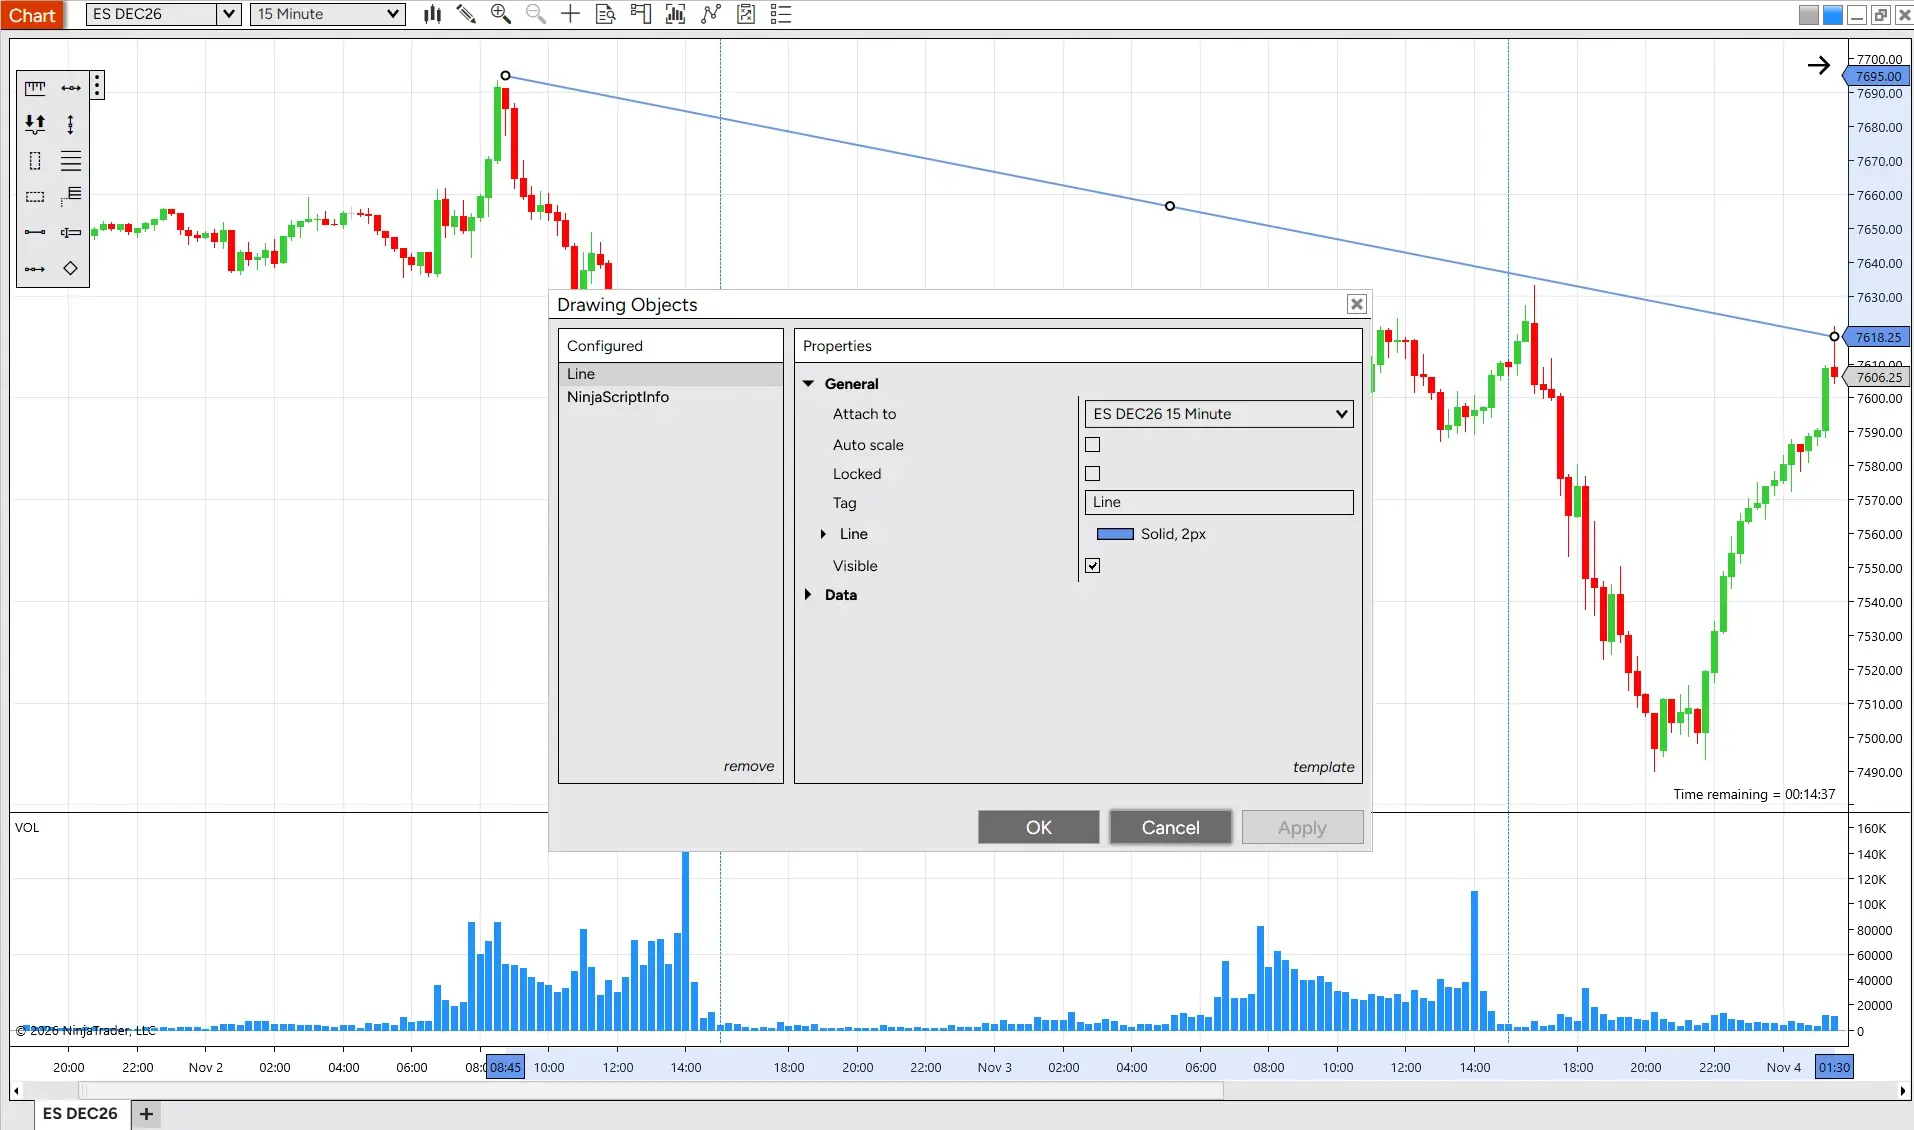
Properties decide how a line looks, Locked and Attach decide how it behaves, and a template carries its settings to the next one.
A drawing object can also be used in an alert.
Can you set an alert from a drawing object?
You can add a drawing object on a chart as a condition object in an alert. Select the drawing object, right-click it, and choose the chart alert option from the menu. The object is then added to the alert's conditions, and the guide to configuring alerts covers the rest of the alert's settings.
NinjaTrader's desktop platform also has an indicator that plots trendlines on its own.
Can NinjaTrader draw trendlines for you?
NinjaTrader's TrendLines indicator can plot trendlines automatically from price action, and its Strength field sets the sensitivity of the automatic detection. The indicator is added from the Indicators window, opened with Ctrl + I or from the right-click menu, and its properties also include the number of trendlines displayed. The TrendLines indicator guide has the full setup steps.
NinjaTrader's TrendLines indicator can plot trendlines automatically from price action, and its Strength field sets the sensitivity of the automatic detection.
The indicator plots its own lines, while the tools above place drawing objects that you position yourself.
Can you add third-party indicators to your charts?
Third-party indicators built for NinjaTrader's desktop platform come from developers outside NinjaTrader, and third-party indicators and apps can help you fine-tune your technical analysis. They appear in the same Available list in the Indicators window as the built-in indicators, so they are added the same way, as the charting setup walkthrough shows.
The NinjaTrader Ecosystem Vendors featured are independent of NinjaTrader, LLC and its affiliated companies ("NinjaTrader"). NinjaTrader does not endorse or recommend any particular trading system or strategy.
Because each indicator is built by its own developer, what it plots varies from one tool to the next.
Start drawing trendlines in NinjaTrader
The Line, Ray, and Extended Line tools are all part of NinjaTrader's desktop platform. For more on technical analysis, see Technical Analysis Made Easy. Ready to draw trendlines on your own charts?
Terms apply.
FAQs on drawing trendlines on a chart
What is the hot key for the Line tool in NinjaTrader?
The default hot key for the Line tool in NinjaTrader's desktop platform is F2. The Ray is F3 and the Extended Line is F4, and the Drawing Tools menu lists each tool's hot key beside its name.
What is the difference between a ray and an extended line?
A Ray extends past its anchor points in one direction, while an Extended Line extends past them in both directions. The Line tool, by comparison, runs only between its two anchor points.
Can you draw a trend channel in NinjaTrader?
Yes. The Trend Channel tool in NinjaTrader's desktop platform draws a channel in three clicks, and its default hot key is Ctrl + 2.
How do you delete a trendline?
To delete a trendline, select it and press Delete, or right-click it and choose Remove. A locked trendline stays on the chart when Remove All Drawing Objects is used.
Can you show the same trendline on other charts of an instrument?
Yes. In NinjaTrader's desktop platform, the Attach to setting in a line's properties applies the line to a single chart or to all charts of the same instrument, so a trendline drawn once can appear on other charts of that instrument.