Depth of market (DOM), also called market depth, shows the buy and sell orders resting at each price level in a futures market, along with the best bid, the best ask, and the last traded price. Order flow looks at something different: the trades that have already executed. This guide shows you how to read a DOM and how order flow fits with it, then walks through both in the NinjaTrader Desktop platform.
What is depth of market?
Depth of market (DOM) is a live display of the current buy and sell orders resting at each price level (tick) of a futures market. You'll hear it called market depth, the order book, and Level 2, depending on who you're talking to.
DOM trading is the term for trading with a DOM on screen.
This guide stays on the reading side: what a DOM shows and what it can't tell you.
The ladder below uses illustrative prices and sizes: sell orders (the ask side) stack above the last traded price, and buy orders (the bid side) sit below.
| Size (contracts) | Price | Size (contracts) | What it is |
|---|---|---|---|
| 106 | 30 | Ask side | |
| 105 | 20 | Ask side | |
| 104 | 15 | Inside ask (best ask) | |
| 25 | 103 | Inside bid (best bid) and last traded price | |
| 40 | 102 | Bid side | |
| 50 | 101 | Bid side |
Figure 1: Illustrative ladder. The spread is the gap between the inside bid (103) and the inside ask (104), in bold numbering.
How to read a DOM
Reading a DOM comes down to five steps, taken in order.
- Find the price ladder. The ladder is a column of prices, with higher prices at the top and lower prices at the bottom. Every other number on a DOM lines up against one of those rows.
- Check the bid and ask sizes. Bid size is how many contracts are resting to buy at a price, and ask size is how many are resting to sell. The inside bid and inside ask are the best prices on each side.
- Locate the last trade. The last traded price shows where the most recent trade happened, and its size. Compare it with the inside bid and inside ask to see which side the trade hit.
- Spot your working orders. Working orders are orders you've placed that haven't filled yet. On a DOM with order entry, such as the SuperDOM, they appear at their price on the ladder, in context with the depth.
- Note where orders show. Buy limit orders show below the current price on the bid side, and sell limit orders show above it on the ask side. Stop orders sit on the other side of the current price from limit orders in the same direction: buy stops above it, sell stops below.
Apart from the last trade, a DOM shows only what's waiting to trade. To see what has actually traded, you need order flow.
What is order flow?
Order flow is the study of executed trades, meaning how much volume traded at each price and whether it traded at the bid or the ask, while a DOM shows orders that are still resting and haven't traded.
A handful of tools can help make that activity visible.
- Time and sales: A running list of executed trades, with the price, volume, and time of each. Our guide to time and sales covers the window in detail.
- Volume at price: How much volume traded at each price level.
- Delta: The difference between ask volume and bid volume. Cumulative delta keeps a running total of it.
- Footprint charts: A chart that shows bid and ask volume at each price within a bar. NinjaTrader calls them volumetric bars. Our guide to footprint charts goes deeper.
For the full set of tools, start with our guide to order flow indicators.
How DOM and order flow fit together
A DOM shows what's waiting to trade, and order flow shows what has already traded.
| Aspect | Depth of market (DOM) | Order flow |
|---|---|---|
| What it shows | Buy and sell orders resting at each price | Trades that have already executed, by price and by bid or ask |
| What it’s based on | Resting order sizes at each price level | Executed trade volume |
| Where it sits in time | What is waiting to trade right now | What has already traded |
| Where you see it in NinjaTrader Desktop | SuperDOM; the market depth map in Order Flow+ | Time and Sales window; volumetric bars; cumulative delta (Order Flow+) |
| What it can't tell you | Displayed size can change without warning, and it shows what's resting rather than intent | It describes what has already happened, so it can help you react, not predict |
Using the DOM in NinjaTrader
The NinjaTrader Desktop platform gives you a DOM in the SuperDOM, and its Order Flow+ feature set adds order flow tools to your charts.
Open the SuperDOM
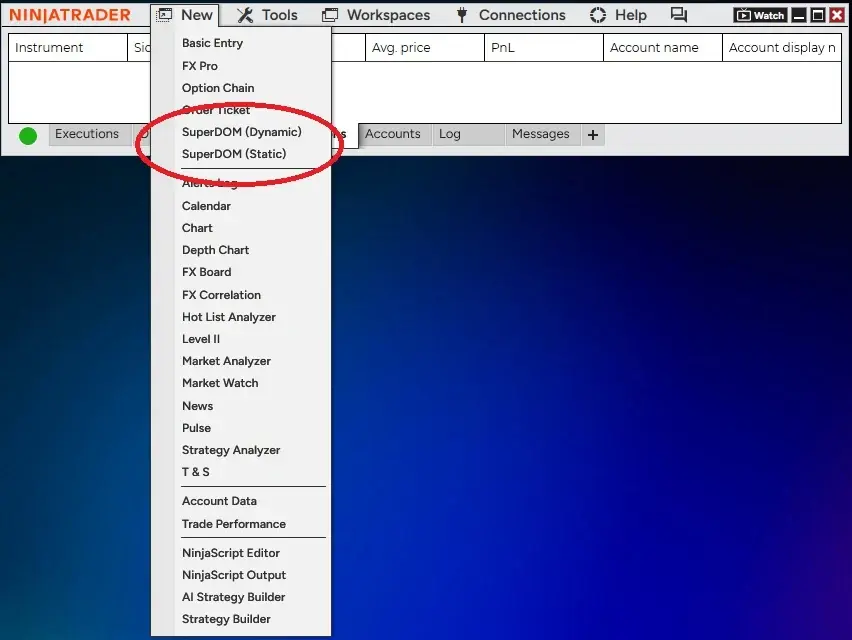
Open the SuperDOM from the Control Center. Select the New menu, then choose SuperDOM (Static) or SuperDOM (Dynamic).
This section sticks to reading the display. For placing and moving orders, see our guide to the SuperDOM.
Read the SuperDOM columns
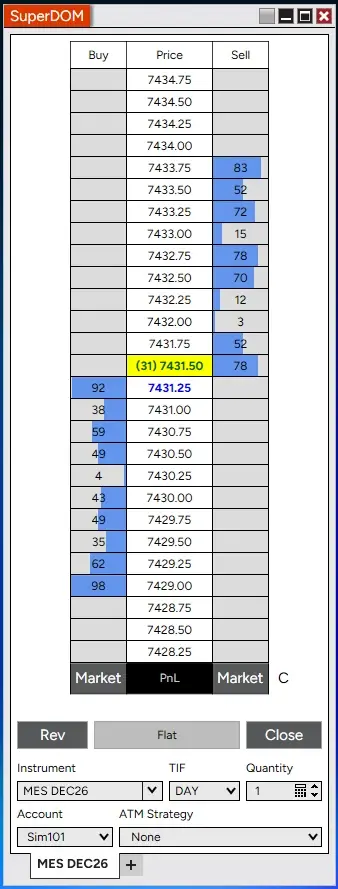
In the NinjaTrader Desktop platform, the SuperDOM is a depth of market ladder with three default columns: the Buy column shows bid size at each price, the Price column shows market prices, and the Sell column shows ask size.
By default, the last traded price and size show in a yellow cell in the Price column, the inside bid shows in blue text, and the inside ask shows in green text.
The SuperDOM shows up to 10 market depth levels by default, depending on what your exchange and data provider supply. You can show more, up to the number they provide.
Any trading symbols, company names, logos, or trademarks displayed are used for illustrative purposes only and remain the property of their respective owners. Their use does not imply affiliation with, endorsement by, or sponsorship of NinjaTrader, nor do any trading symbols displayed constitute investment advice or recommendations.
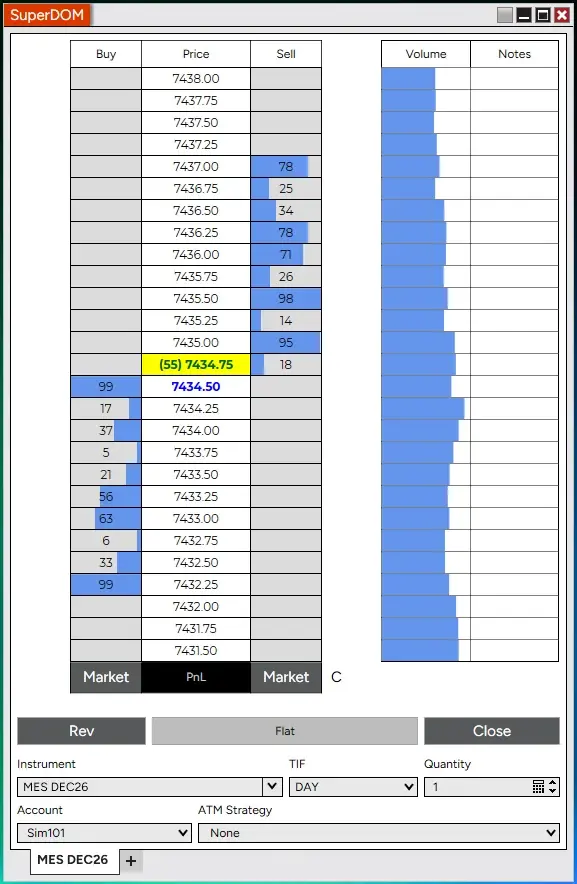
You can also add optional columns, including Volume, Notes, and Approximate Position in Queue (APQ).
Add order flow tools to a chart
NinjaTrader's Order Flow+ feature set includes volumetric bars (footprint charts), cumulative delta, volume profile, order flow VWAP, a trade detector, and a market depth map.
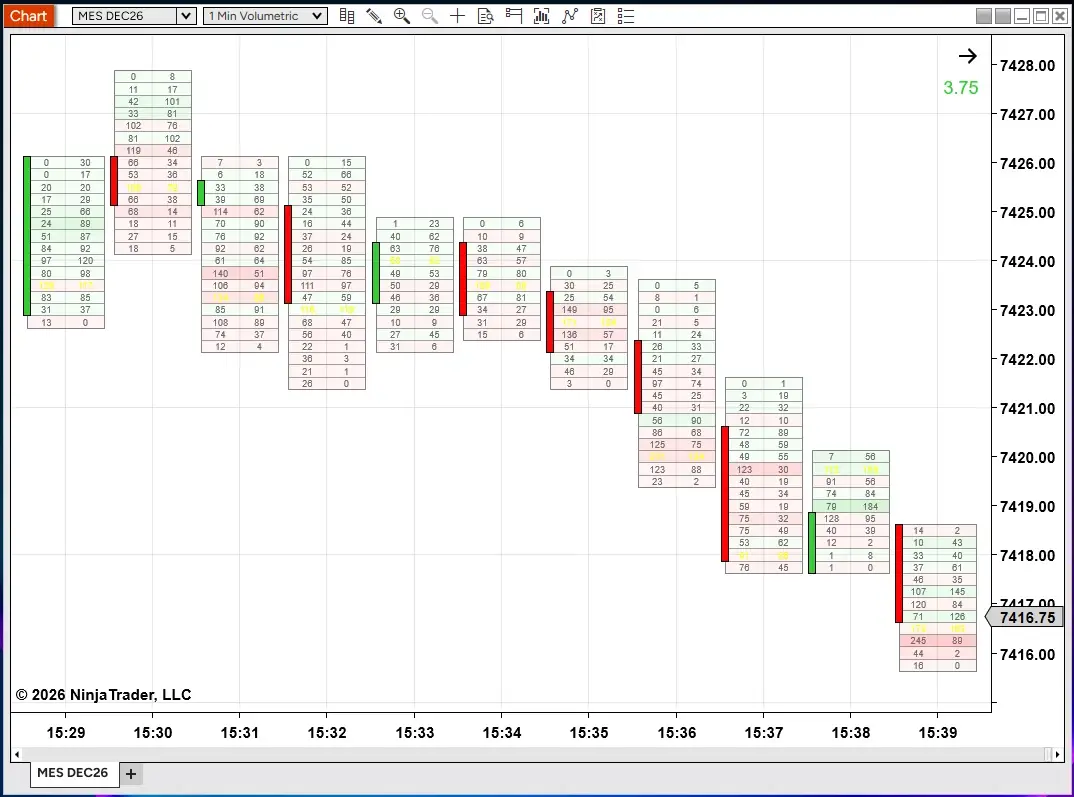
Volumetric bars put bid and ask volume inside each bar.
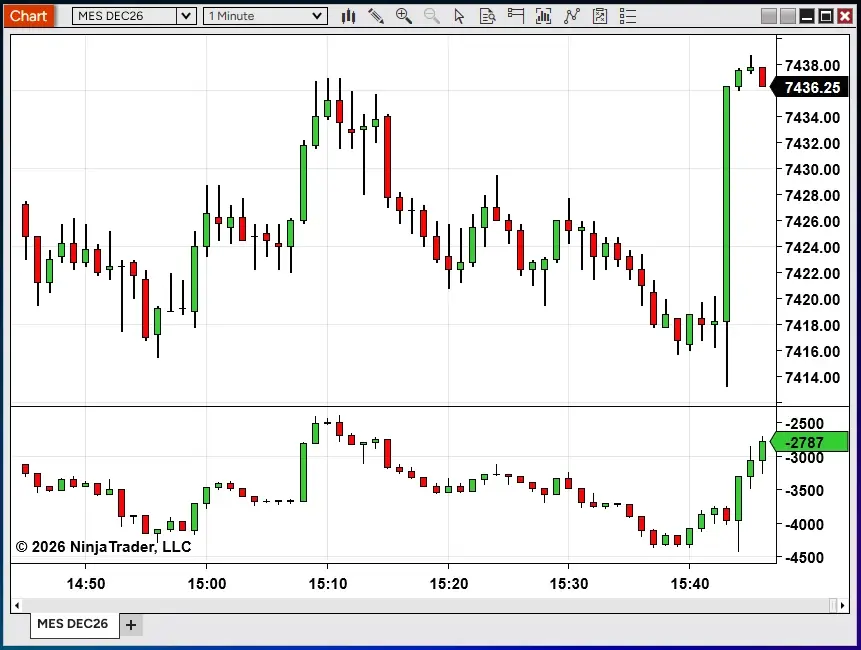
Cumulative delta draws in a panel below the price data, so you can read the running net total against price.
The market depth map plots resting orders across prices over time, so you can see how the book changed.
What data you need for Order Flow+
To split volume into buying and selling at the bid and ask, NinjaTrader's volumetric bars need historical bid and ask tick data from your data provider; if a provider supplies only last-price ticks, an up-tick and down-tick method is available instead.
Forex spot data isn't supported. You can see which market data providers the NinjaTrader Desktop platform supports under market data and brokerage options.
Order Flow+ and real-time market data unlock when you add funds to your live account. All NinjaTrader plans (Free, Monthly, and Lifetime) require a funded, approved live account before benefits become active. NinjaTrader pricing has the plan details.
Explore DOM and order flow in NinjaTrader
Resting orders, the best bid and ask, the last traded price: a DOM puts it all in one view. Open a free NinjaTrader account and dive into the SuperDOM in the NinjaTrader Desktop platform. Terms apply.
FAQs on depth of market and order flow
Which futures platform supports depth of market and order flow charts like footprint and delta?
The NinjaTrader Desktop platform supports depth of market and order flow charts. The SuperDOM shows market depth, and the Order Flow+ feature set adds volumetric bars (footprint charts), cumulative delta, and delta bars to your charts.
What platform features matter most for order flow trading, including DOM tools and footprint charting?
Each tool answers a different question. A DOM shows what's resting at each price, and Time and Sales shows what traded. Volumetric bars show bid and ask volume at each price within a bar, and delta and cumulative delta show the net balance of aggressive buying and selling. Volume profile shows how volume spread across prices over a period, and the market depth map plots how resting orders changed over time. In the NinjaTrader Desktop platform, those tools are the SuperDOM, the Time and Sales window, and the Order Flow+ feature set.
How does the NinjaTrader Desktop platform handle order flow analysis?
In the NinjaTrader Desktop platform, Order Flow+ adds a bar type and indicators to your charts: cumulative delta, delta bars, market depth map, price on volume bars, trade detector, volume profile, volumetric bars, and VWAP. The SuperDOM and Time and Sales windows sit alongside them.
How does the NinjaTrader Desktop platform handle order entry and depth-of-market liquidity?
The SuperDOM combines point-and-click order entry with market depth in one window, and it shows up to 10 depth levels by default, depending on what your exchange and data provider supply. The size shown at a price can change at any moment, so the display reflects what's resting right now.
Which platforms offer delta volume and market depth indicators?
NinjaTrader's Order Flow+ offers cumulative delta, delta bars, volumetric bars, and a market depth map.
What market data is needed to use Order Flow+ delta indicators or volumetric bars?
Splitting volume into buying and selling at the bid and ask takes historical bid and ask tick data from your data provider. If a provider supplies only last-price ticks, an up-tick and down-tick method is available instead. Forex spot data isn't supported. Your account also has to be funded to unlock Order Flow+ and real-time market data.
Glossary
- Depth of market (DOM): A display of the buy and sell orders resting at each price level, along with the best bid, the best ask, and the last traded price. Also called market depth.
- Market depth: Another name for depth of market.
- Order book: The list of resting buy and sell orders in a market. A DOM shows it price by price.
- Level 2: Market data that lists the bid and ask prices and how many contracts are resting at each.
- Bid and ask: The bid is the highest price a buyer is willing to pay, and the ask is the lowest price a seller is willing to accept.
- Liquidity: How much buying and selling interest is available in a market, which affects how easily orders can fill.
- Time and sales: A running list of executed trades, with the price, volume, and time of each. In the NinjaTrader Desktop platform, it's the Time and Sales window.
- Volume at price: The amount of volume that traded at each price level.
- Delta: The difference between ask volume and bid volume. Positive delta means buyers were more aggressive, and negative delta means sellers were.
- Cumulative volume delta (CVD): A running total of delta over time. NinjaTrader labels the indicator cumulative delta.
- Footprint chart: A chart that shows bid and ask volume at each price level within a bar. NinjaTrader calls footprint charts volumetric bars.
- Volumetric bars: NinjaTrader's name for footprint charts, part of the Order Flow+ feature set.
- Order Flow+: NinjaTrader's order flow feature set, including volumetric bars, cumulative delta, volume profile, order flow VWAP, a trade detector, and a market depth map.
- SuperDOM: The depth of market ladder in the NinjaTrader Desktop platform, with Buy, Price, and Sell columns.