Macro Moves in Focus: What's Shaping Markets Now?
Senior Economist Tracy Shuchart and Senior Market Strategist Jim Cagnina unpack the latest macro events shaking up global markets. Dive into our latest biweekly report to uncover what's driving the action and how these moves might impact your trading strategy.
Metals
The metals market experienced notable movements influenced by geopolitical tensions, trade policies, and economic indicators.
Copper Futures
Copper prices made a new high during the week of March 17-21, 2025. The price of copper surged past $10,000 per ton for the first time in five months. This increase was driven by growing concerns over potential supply shortages and strong demand, especially from key industrial sectors.
Factors contributing to this rise include:
Supply constraints: Ongoing disruptions in major copper-producing regions, including labor strikes in Chile and lower-than-expected production in Peru, have raised concerns about future copper supply.
Demand from China: Despite broader economic concerns, there was still strong demand from China, the largest consumer of copper, particularly as the country continues to ramp up its infrastructure and green energy projects.
Geopolitical tensions: Copper's price surge was also linked to geopolitical instability, including the ongoing Russia-Ukraine conflict, which raised concerns about disruptions in global supply chains and trade flows
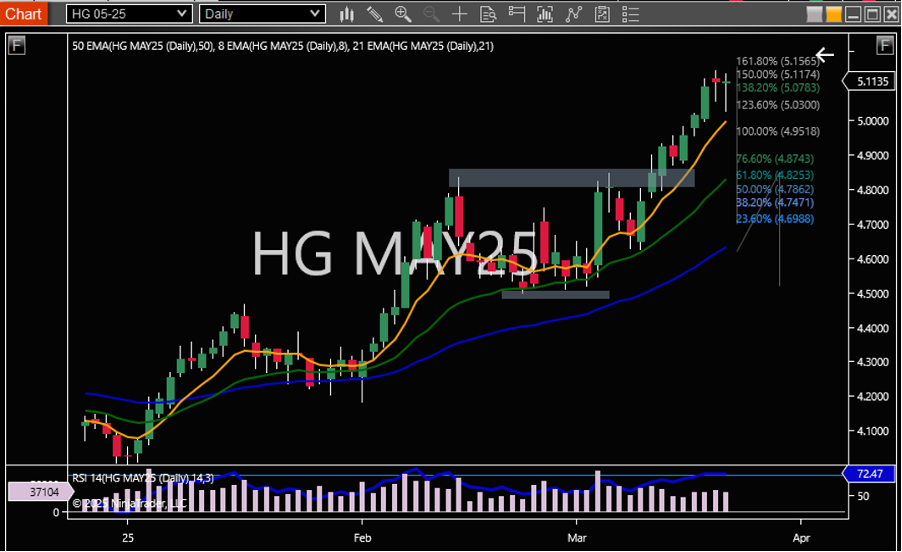
Copper: Technical Analysis
The May copper futures continued to make new highs after a double top breakout to the upside. The rally paused on Thursday and Friday, creating back-to-back DOJI candles on the dailies. Friday’s huge buyers’ wick can be interpreted as a pause, bringing us back up to where we started. The next Fibonacci extension target is 161.80% at $5.1565. The RSI is over bought at 72.47, but we can stay +70 for a while.
Gold Futures
Gold futures hit an all-time high of $3065 before retreating.
Ongoing geopolitical instability, particularly the Russia-Ukraine conflict, played a pivotal role in pushing gold prices higher. As tensions escalated, investors flocked to gold as a safe-haven asset, which is traditionally viewed as a store of value during times of uncertainty. Additional concerns in the Middle East also supported gold, further reinforcing its appeal as a protective asset.
U.S. Dollar and Inflation
Inflation hedge: As inflation concerns persisted globally, particularly in major economies, gold prices receive support from investors seeking to hedge against currency devaluation and rising prices.
Interest rate speculation: Gold’s movement was also influenced by speculation over the Fed’s next steps in monetary policy. A more dovish stance could encourage investment in gold, while further interest rate hikes might have put downward pressure on its price.
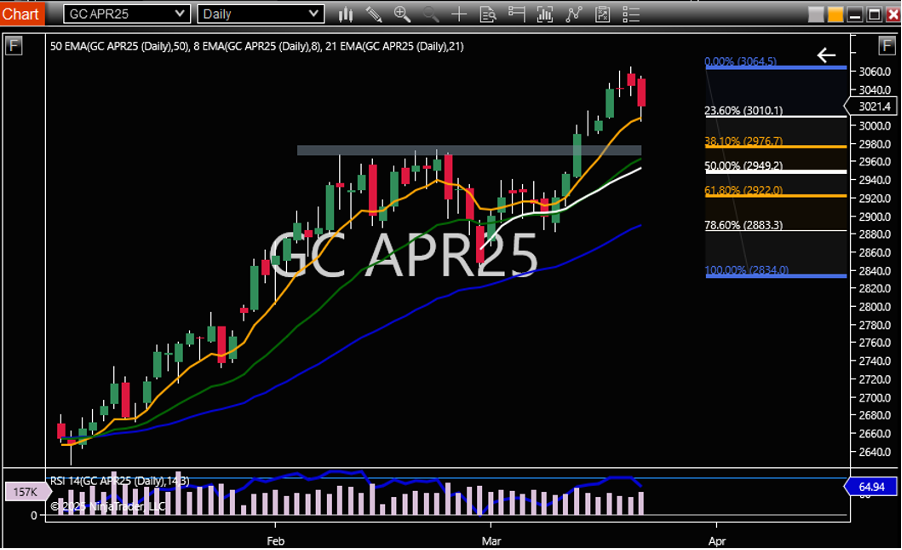
Gold: Technical Analysis
The April gold futures contract peaked on Thursday at $3065.2 before the end of week retracement back to $3021.4. Gold is still firmly entrenched above a prominent area of support between $2968 and $2980. The first Fibonacci level at 23.60% and the 8 EMA were both tested on Friday. Next Fibonacci level to the downside is 38.1% at $2976.
Energy
The energy sector, particularly crude oil and gasoline markets, experienced notable fluctuations.
Crude oil Futures
Geopolitical tensions, especially in regions like the Middle East and Eastern Europe, contributed to market volatility. These concerns led to fluctuations in oil prices, as investors reacted to potential supply disruptions. Keep in mind that shale breakevens are $65 on average (some basins more, some less). It is not surprising that we see buyers come in at that $65 buck range.
Crude Oil - Technical Analysis
WTI light sweet crude oil closed above the 8 EMA for th first time since February 20. The market has been rangebound between 68.07 and 65.95 since May 5, although Friday closed slightly higher at 68.28. The 50 EMA is a possible target for the bulls on the breakout to the upside at 6975. The RSI is at 48.16 and not a factor.
Gasoline Futures
We are at the height of refinery maintenance season, which means that refinery capacity is down due to scheduled maintenance. This is why we are seeing outsized draws, in gasoline and diesel inventories.
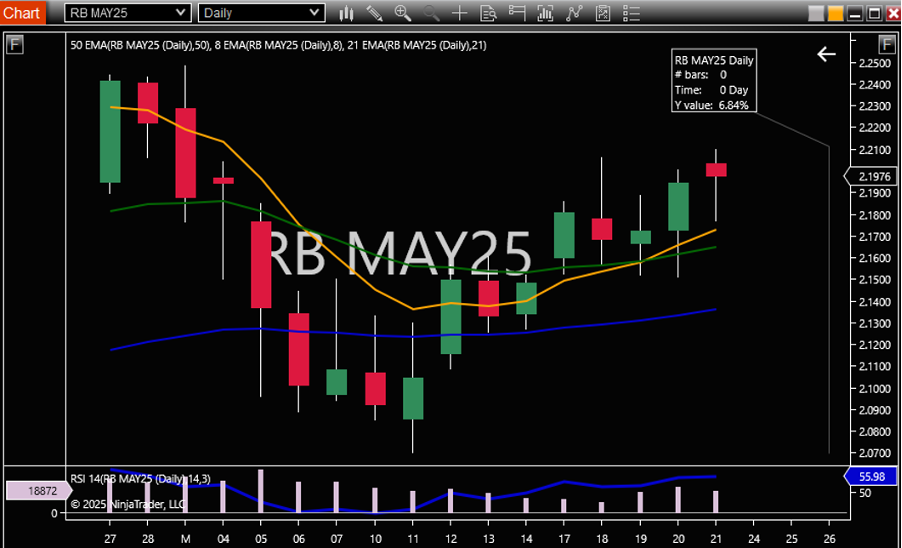
Gasoline Technical Analysis
RBOB gasoline futures are up 6.84% since their May 11 lows. The 8 EMA crossed over the 21 EMA on Thursday giving bulls a reason to believe. The RSI is comfortably neutral at 55.98.
Equities
U.S. equities experienced modest gains overall, with broad-based strength across multiple sectors.
This says we are seeing a rotation from heavily weighted tech into other defensive sectors. Financials and energy stocks were some of the biggest gains, again highlighting a clear rotation. Investors reacted positively to earnings and outlooks for major banks and oil companies. Unsurprisingly, healthcare also performed well.
Overall, inflation data continued to hover above the Fed's target, leading to speculation that the Fed may hold interest rates higher for a longer period, which contributed to market volatility but also favored sectors like financials and energy.
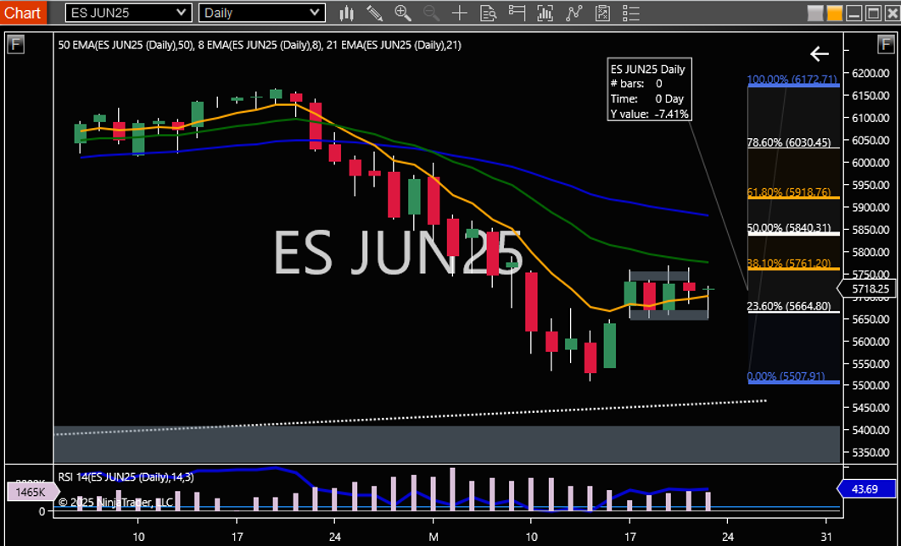
E-Mini S&P 500 Technical Analysis
The E-mini S&P 500 futures last week traded within a tight range between $5730 and $5660. Trading around the 8 EMA for the entire week. Fridays DOJI on the daily candle reflects market indecision without strong directional implications. For the bulls the 21 EMA is converging with the 38.1% Fibonacci level around $5761 and is a potential target. For the bears, the yearly lows of $5509 could be in play. The RSI is equivocal at 43.69.
Interest Rates
The Fed opted to maintain current interest rates, citing a resilient economy despite recent volatility. They indicated the possibility of rate cuts totaling up to 0.5% by year's end, responding to economic uncertainties. Following the Fed's announcement, the yield on 10-year Treasury notes decreased, settling at 4.24%.
Investors directed approximately $22 billion into short-term U.S. government debt in early 2025, seeking safer assets amid economic and trade policy concerns. This influx resulted in a 1-month Treasury yield of 4.37% and a 2-year note yield of 4.00% by March 17, 2025.
Caution on the yield curve right now.
Treasury Note Yields Technical Analysis
The 10-year and 2-year spread in the CME Groups Micro yield futures closed at 33.2 basis points. The 2-year is approaching its recent low of 3.87%, and correspondingly the 10-year downside target is at 4.200%. Yields reflecting a normal curve in the mid-part of the U.S. Treasury curve. 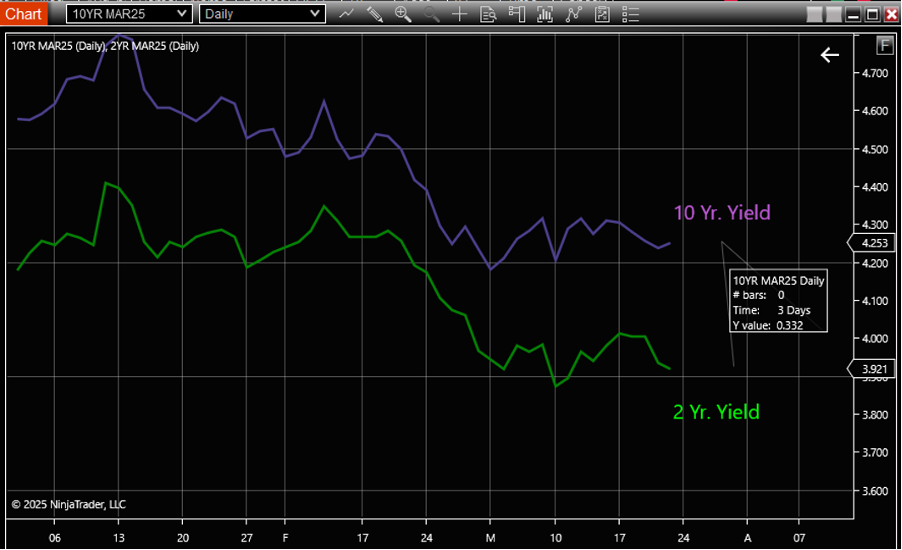

Trade Futures with NinjaTrader
Haven't signed up for your free NinjaTrader account yet? Get started today with a 14-day trial of live simulated futures trading.
